Getting Started with Experiments
This guide will walk you through creating your first experiment and using it to analyze agent performance across multiple sessions.What You’ll Learn
In this tutorial, you’ll:- Create an experiment in the dashboard
- Add existing sessions to your experiment
- Add new sessions programmatically via SDK
- Run failure analysis to identify patterns
- View analytics and insights
Prerequisites
Before starting, ensure you have:- Access to the Lucidic Dashboard
- An agent with some existing sessions
- Your API key and Agent ID configured
- Python or TypeScript SDK installed
Step 1: Navigate to Session History
First, log into the Lucidic Dashboard and navigate to your agent’s session history:- Open the Lucidic Dashboard
- Select your project
- Click on your agent
- Navigate to the Session History tab
If you don’t have any sessions yet, run a few test sessions first using the SDK before creating an experiment.
Step 2: Create Your First Experiment
Select Sessions to Include
- In the Session History view, use the checkboxes to select sessions you want to analyze together
- Choose sessions that are related - for example:
- All sessions testing a specific feature
- Sessions from the same time period
- Sessions with similar configurations
Create the Experiment
- Click the “Create Experiment” button
- In the dialog that appears, configure your experiment:
- Name: Give it a descriptive name like “Login Flow Performance Test”
- Description: Add details about what you’re testing
- Tags: Add tags like
["performance", "login", "v1.0"] - Rubrics: Select any evaluation rubrics to apply
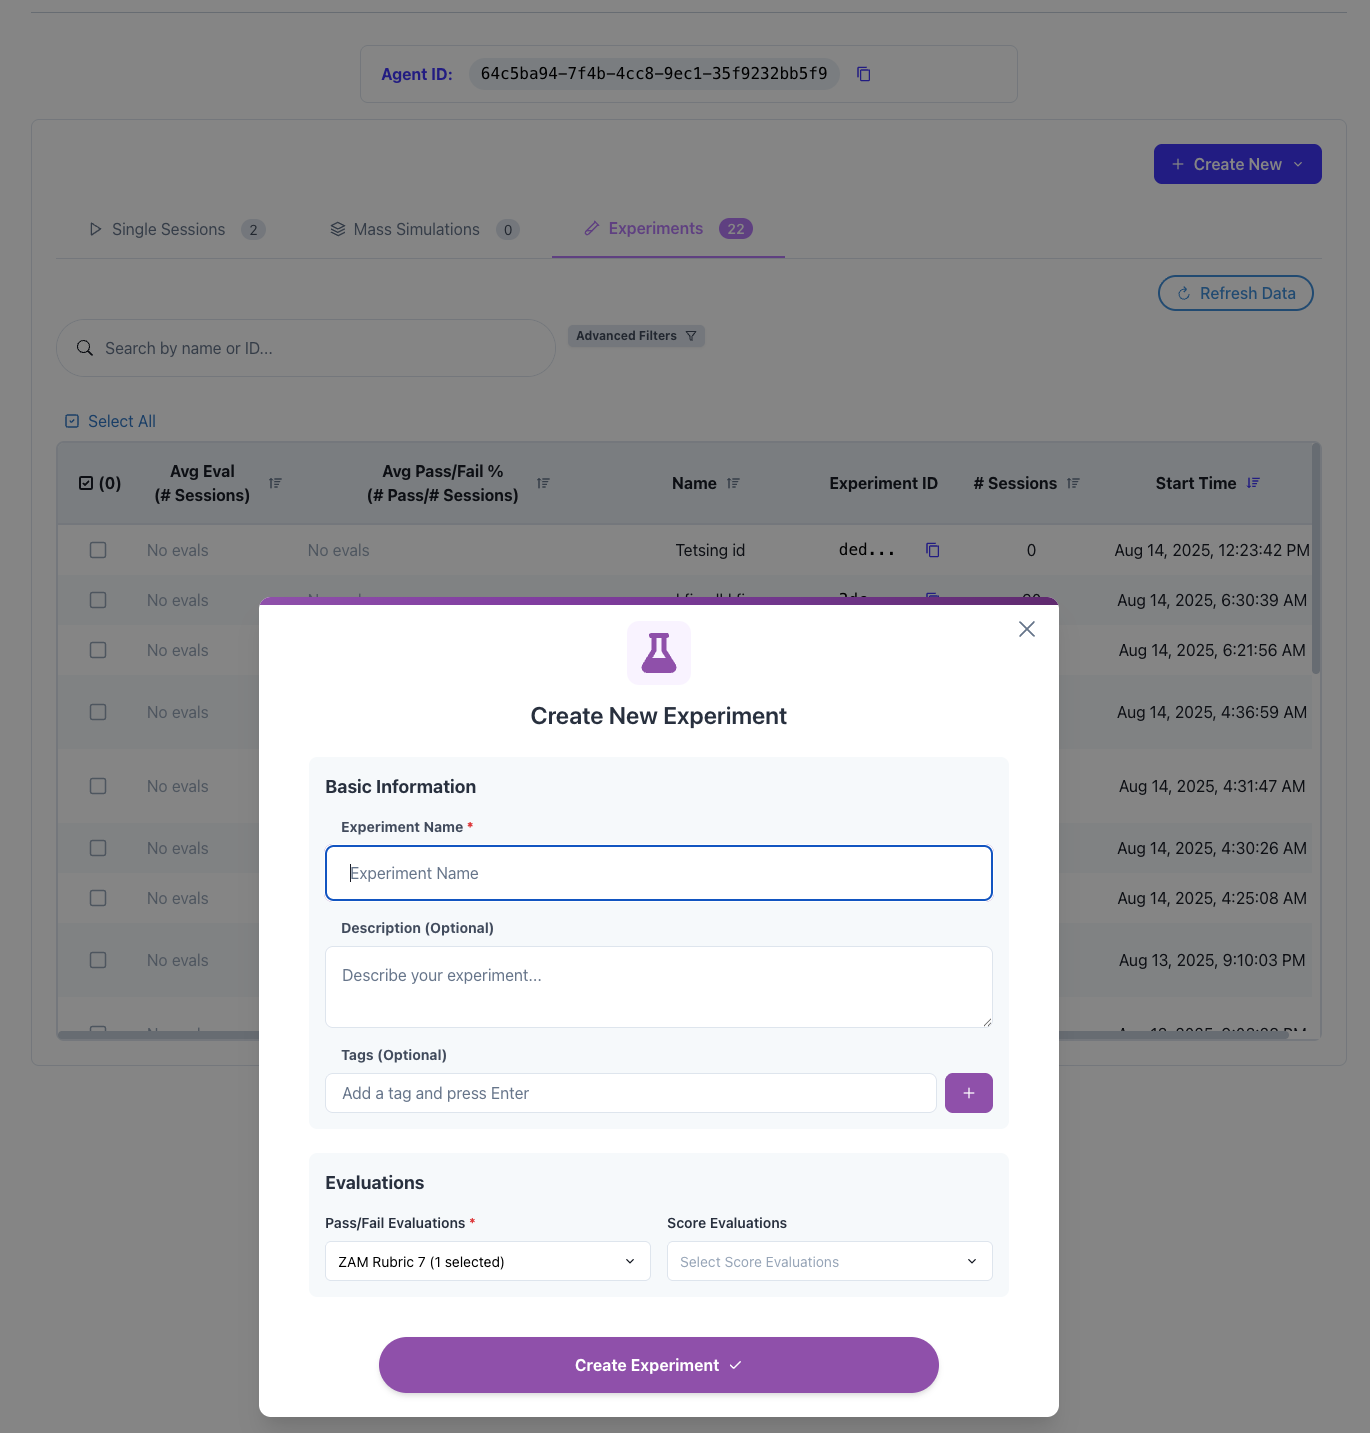
- Click “Create”
Your experiment is now created! You’ll be redirected to the experiment dashboard.
Step 3: Note Your Experiment ID
After creation, you’ll see your experiment dashboard. The URL will contain your experiment ID:Step 4: Add Sessions Programmatically
Now you can add new sessions to your experiment using the SDK:Python Example
TypeScript Example
Step 5: Run Multiple Test Sessions
To get meaningful insights, run multiple sessions with variations:Step 6: View Experiment Analytics
Return to the dashboard to see your experiment’s analytics:- Navigate to your experiment (or refresh if already open)
-
You’ll see overview metrics:
- Total Sessions - Number of sessions in the experiment
- Success Rate - Percentage of successful sessions
- Average Cost - Mean cost per session
- Average Duration - Mean execution time
-
Click the Analytics tab to see visualizations:
- Success/failure distribution pie chart
- Cost analysis graphs
- Duration trends
- Evaluation score distributions
Step 7: Run Failure Analysis
Once you have enough sessions (recommended: 20+), run failure analysis:- In your experiment dashboard, click “Run Failure Analysis”
- Confirm the credit cost (1 credit per 10 sessions)
- Wait for processing (usually 1-2 minutes)
- Identify all failed steps across sessions
- Group similar failures using AI
- Generate named categories with descriptions
- Show you which sessions exhibited each failure pattern
Failure analysis helps identify systematic issues that might not be obvious from individual session logs.
Step 8: Interpret Results
Understanding Failure Groups
Each failure group represents a pattern of similar issues:- Group Name: e.g., “Authentication Timeout Errors”
- Description: Detailed explanation of the failure
- Affected Sessions: Count and list of sessions with this issue
- Representative Examples: Specific instances you can investigate
Taking Action
Based on the analysis:- Prioritize issues affecting the most sessions
- Investigate representative examples for root causes
- Fix the underlying problems in your agent
- Re-test with a new experiment to verify fixes
Example: A/B Testing Workflow
Here’s a complete example of using experiments for A/B testing:Best Practices
When Creating Experiments
- Group related sessions - Don’t mix different types of tests
- Use descriptive names - Make it easy to find later
- Apply relevant rubrics - Set up evaluation criteria upfront
- Document the purpose - Use the description field
When Adding Sessions
- Be consistent - Use similar session names within an experiment
- Add metadata - Use tags to categorize sessions
- Include context - Set the task parameter to describe what’s being tested
- Evaluate properly - Provide meaningful success criteria
When Analyzing Results
- Wait for sufficient data - At least 20-30 sessions for patterns
- Look for trends - Not just individual failures
- Compare experiments - Use multiple experiments for A/B tests
- Act on insights - Use findings to improve your agent
Common Patterns
Performance Benchmarking
Feature Testing
Load Testing
Troubleshooting
Sessions Not Appearing in Experiment
- Verify the experiment_id is correct
- Check that sessions are finishing properly
- Ensure API key has proper permissions
Failure Analysis Not Working
- Need at least some failed sessions
- Ensure you have evaluation credits
- Wait for all sessions to complete first
Missing Analytics
- Refresh the dashboard page
- Check that sessions have ended
- Verify rubrics are properly configured
Next Steps
Now that you’ve created your first experiment:- Explore the detailed feature documentation
- Learn about working with experiments in Python
- Learn about working with experiments in TypeScript
- Understand evaluation rubrics for better analysis
Get Help
Having issues with experiments?- Check the feature documentation for detailed information
- Contact support at support@lucidic.ai
- Join our community Discord for tips and best practices