Mass Simulations
Mass Simulations give you a breakdown of your agent’s behavior over multiple runs. They merge data from dozens or hundreds of sessions to reveal patterns, inconsistencies, and performance metrics at scale. Running an agent workflow once is not enough to understand how it behaves. Agents are non-deterministic and need to be run multiple times to understand their behavior. This is your tool for:- Uncovering hidden failure patterns - Surface recurring agent missteps and edge cases that aren’t obvious in a single run
- Measuring reliability and consistency - Track evaluation metrics like task completion rate, action precision, and failure frequency
- Identifying regressions or improvements - Compare performance across model versions, prompt changes, or code adjustments
- Visualizing agent behavior at scale - Explore aggregated session trajectories and failure categories
How to Create a Mass Simulation
See Creating a Mass SimulationExploring Mass Simulation Analytics
Getting Started
- Head to the session history page and click on the mass simulations tab
1.5 [Optional]. Filter by any tags you added to the session (learn more about creating tags here)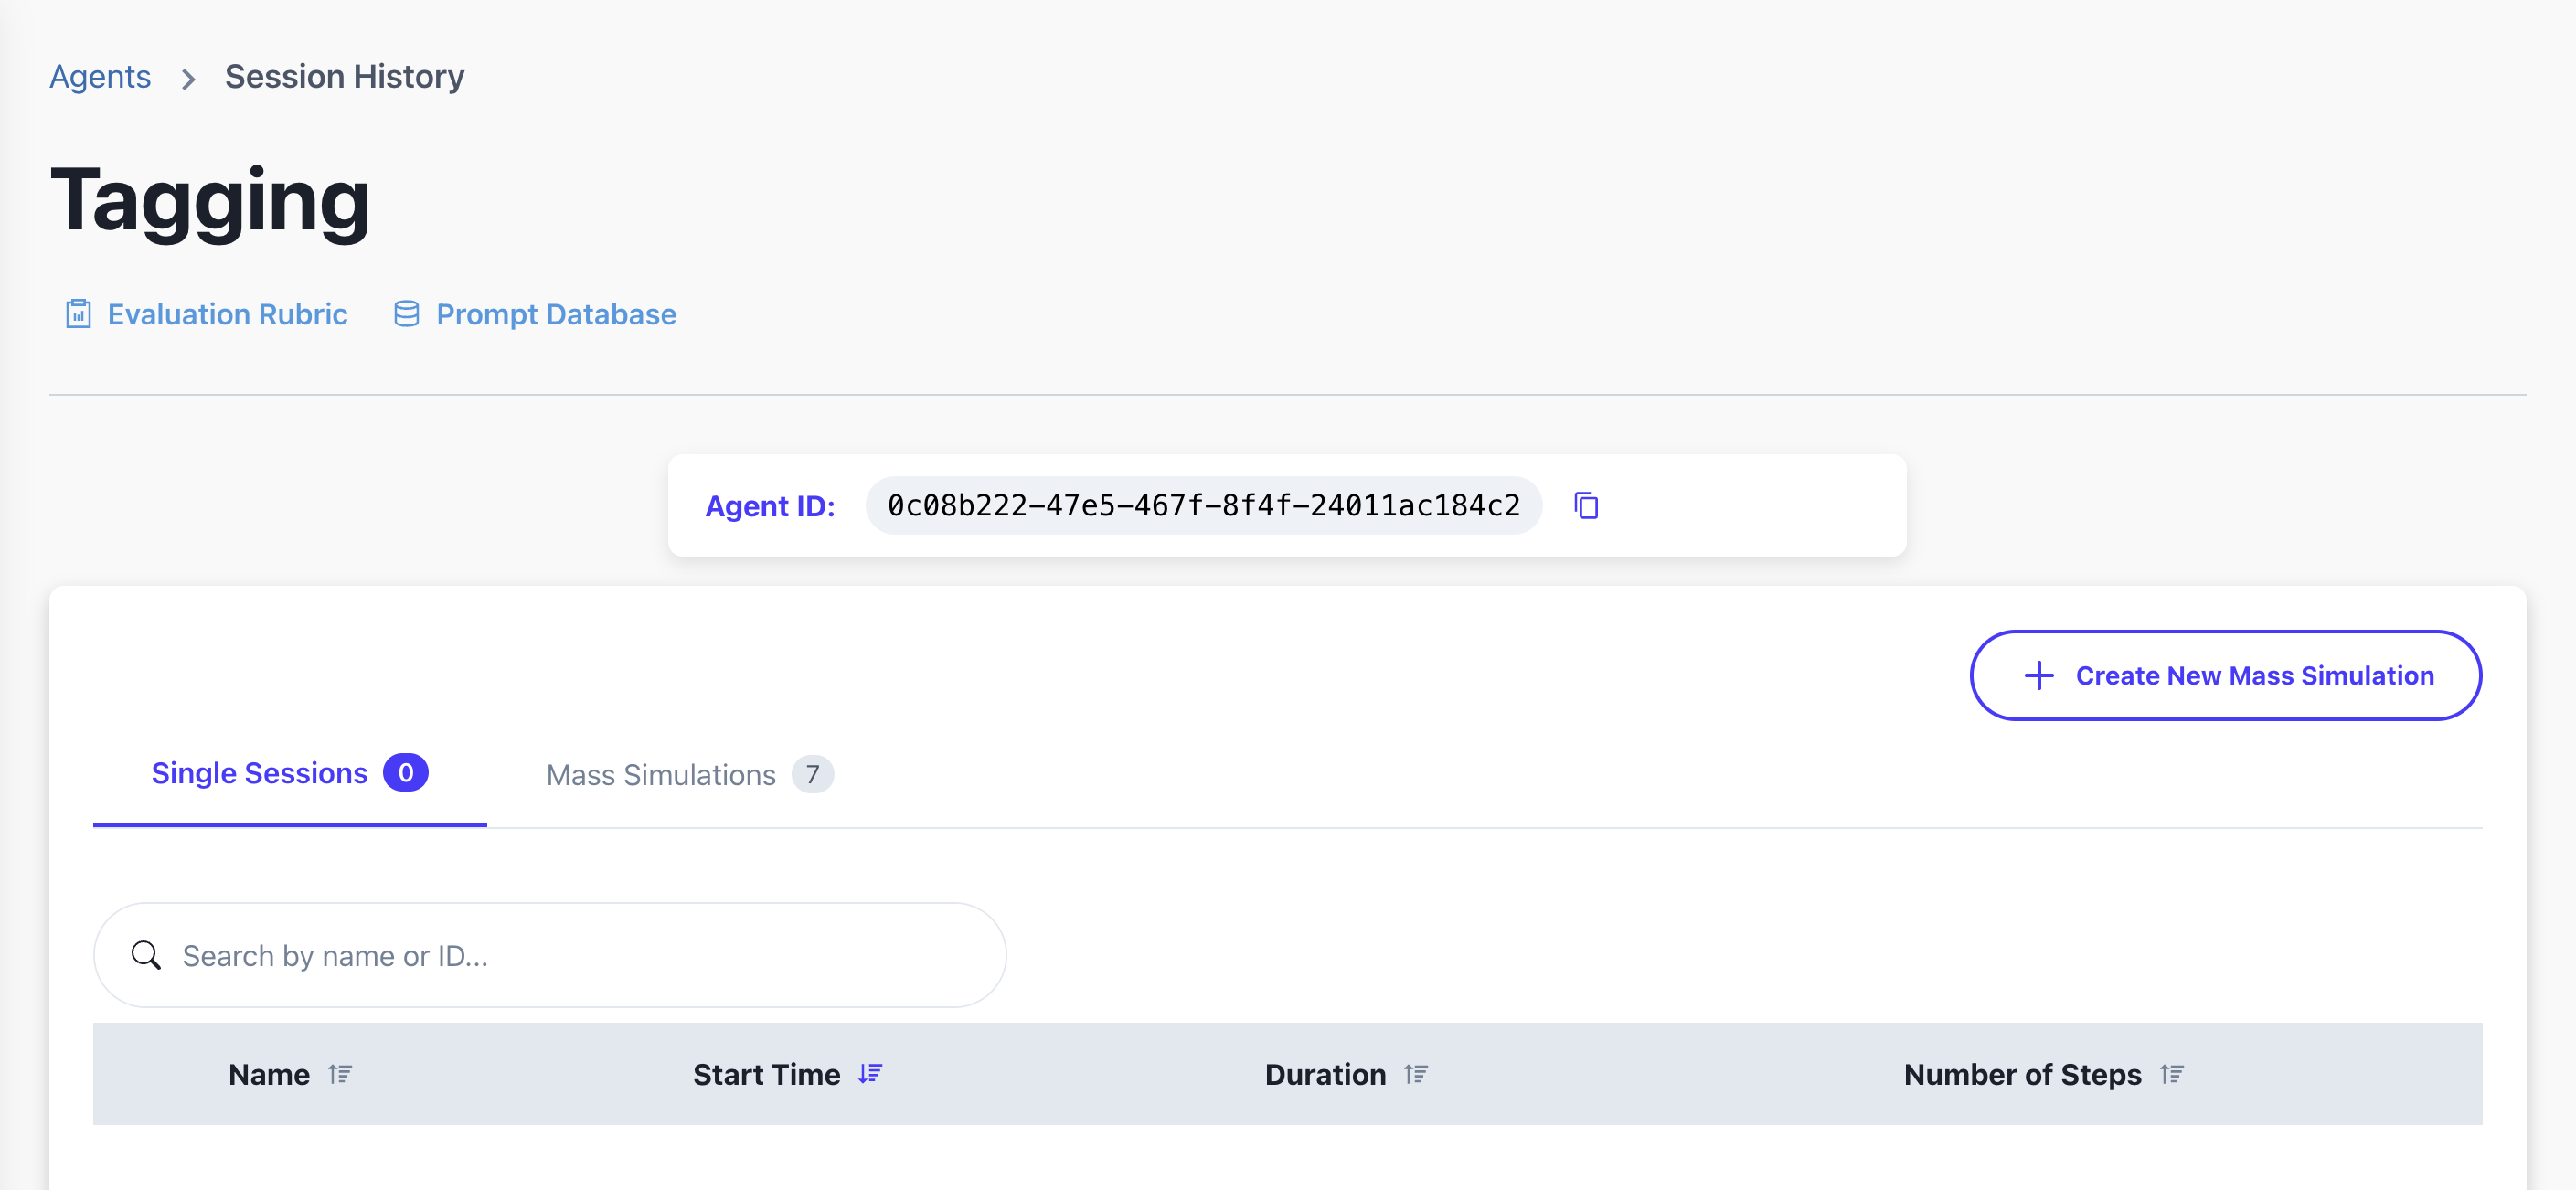

This is useful if you want to quickly analyze a subset of mass simulations.
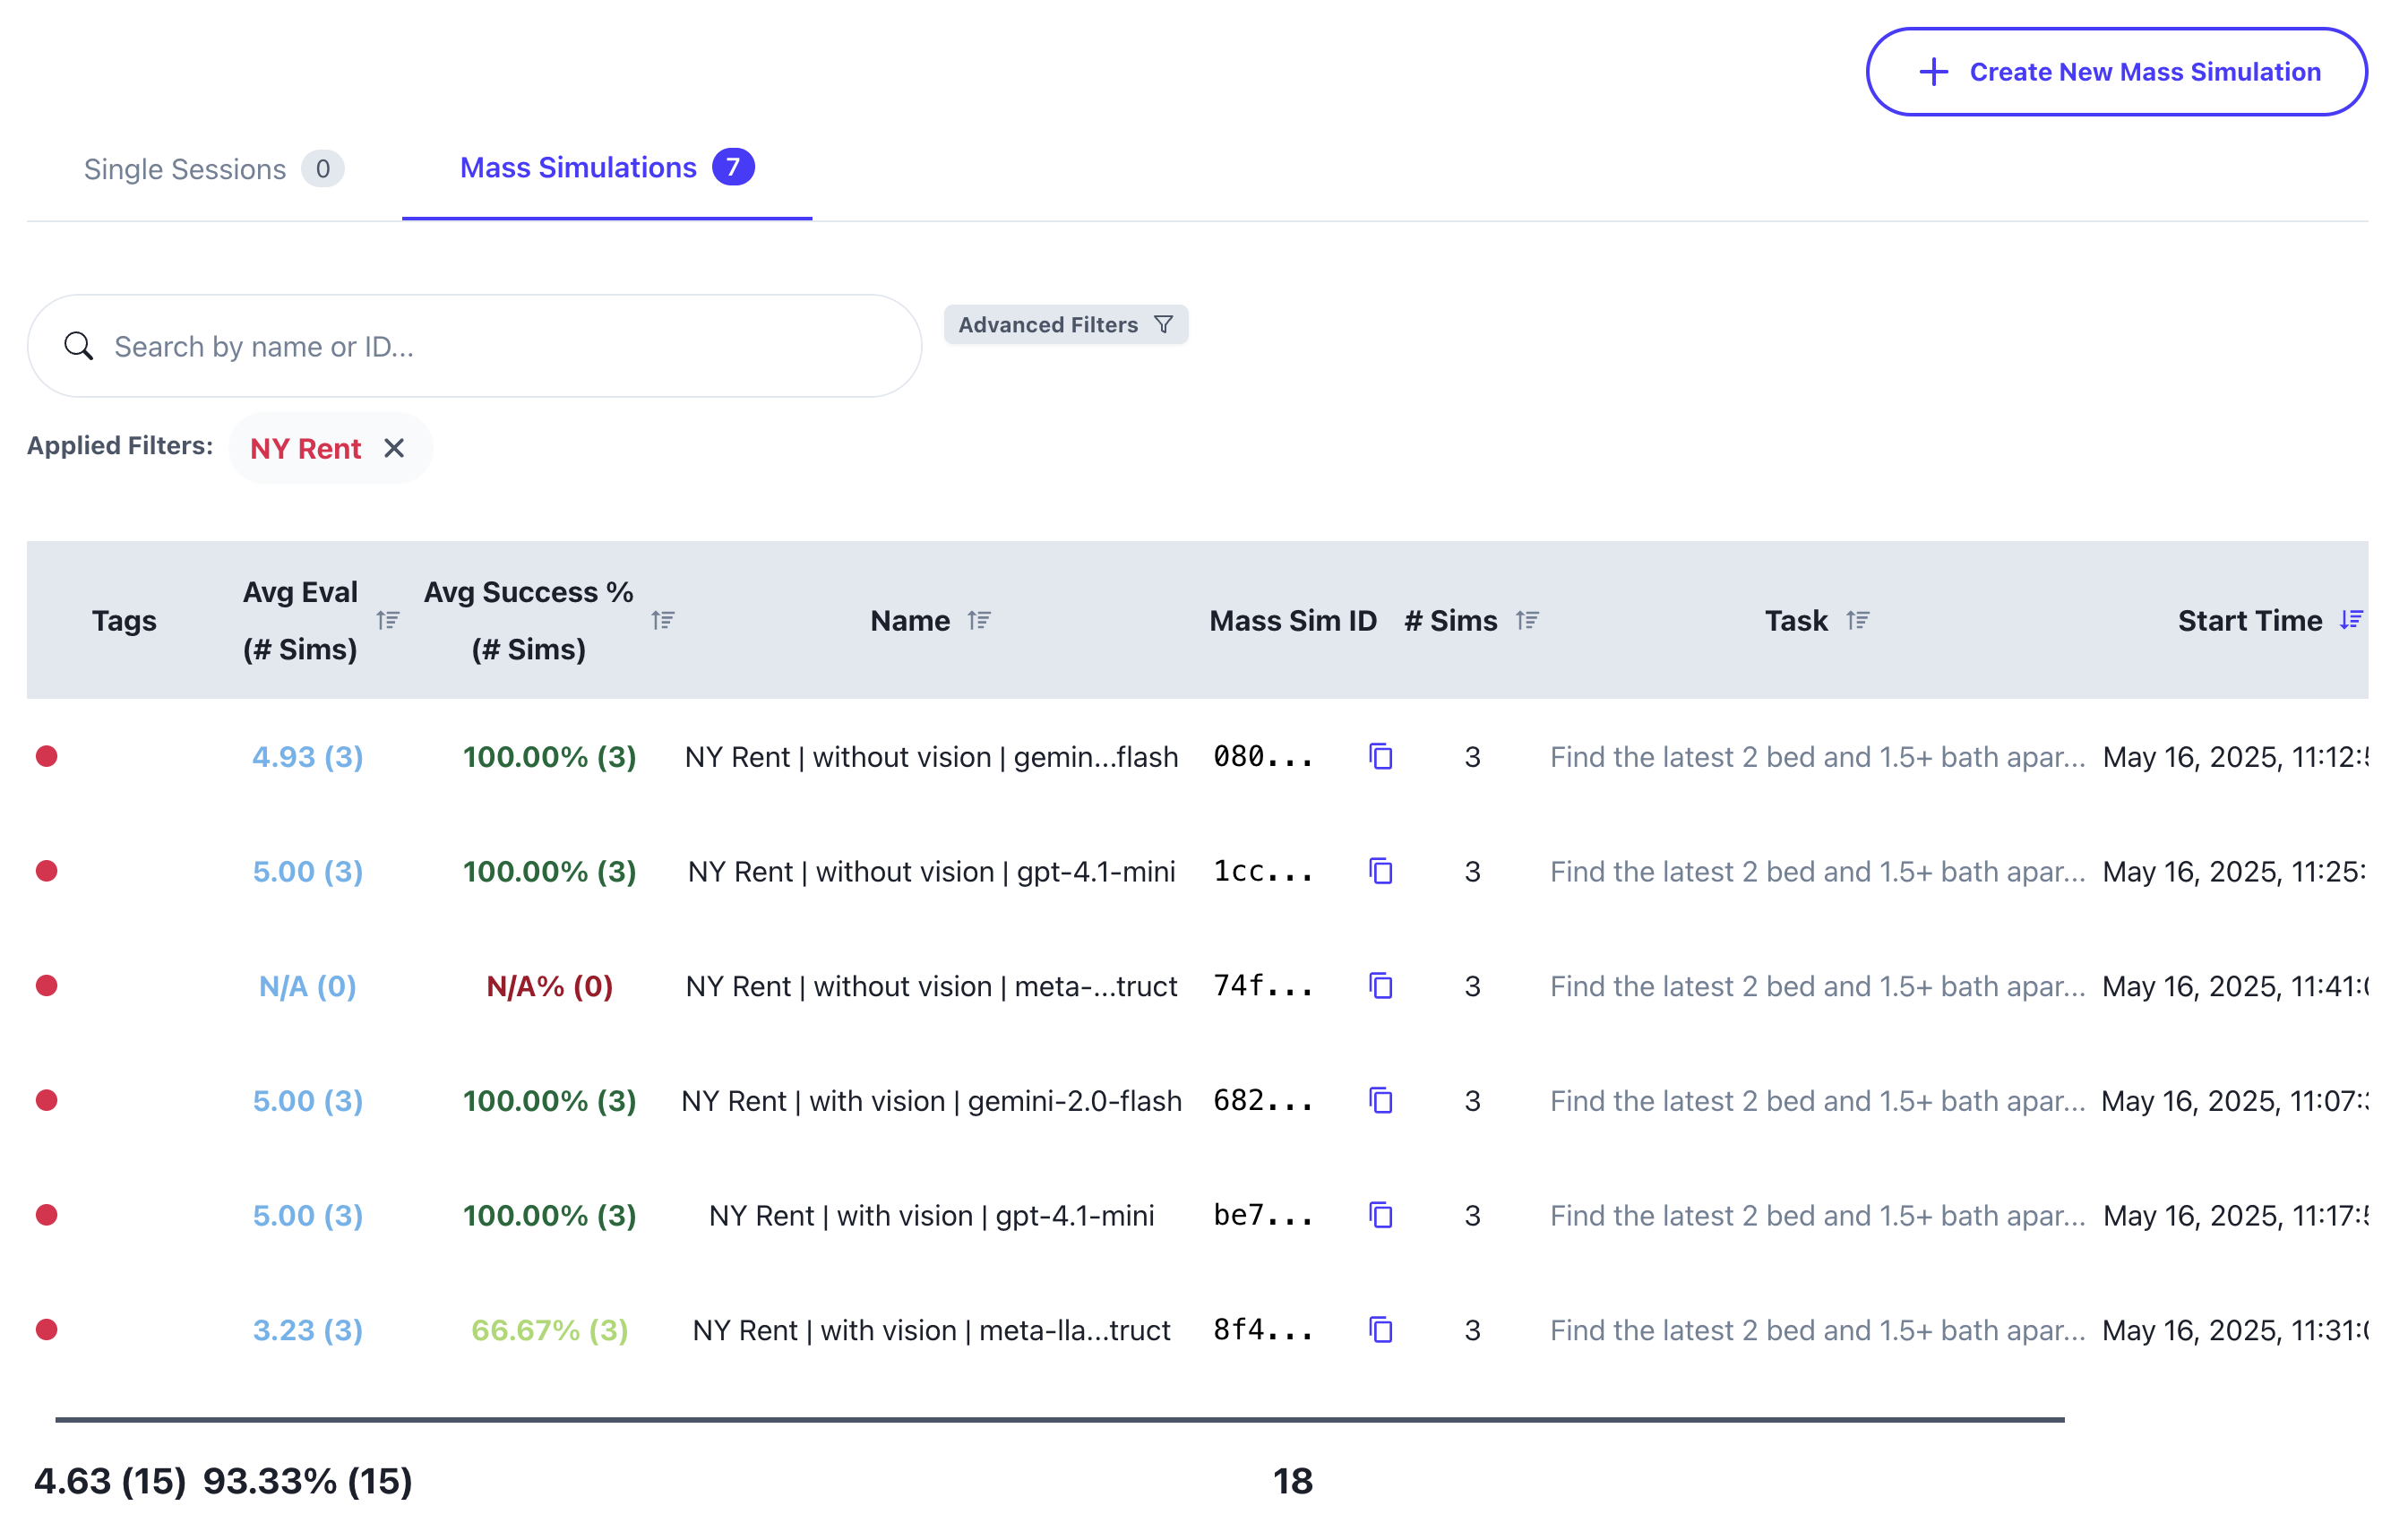
- Click on the mass simulation you want to analyze
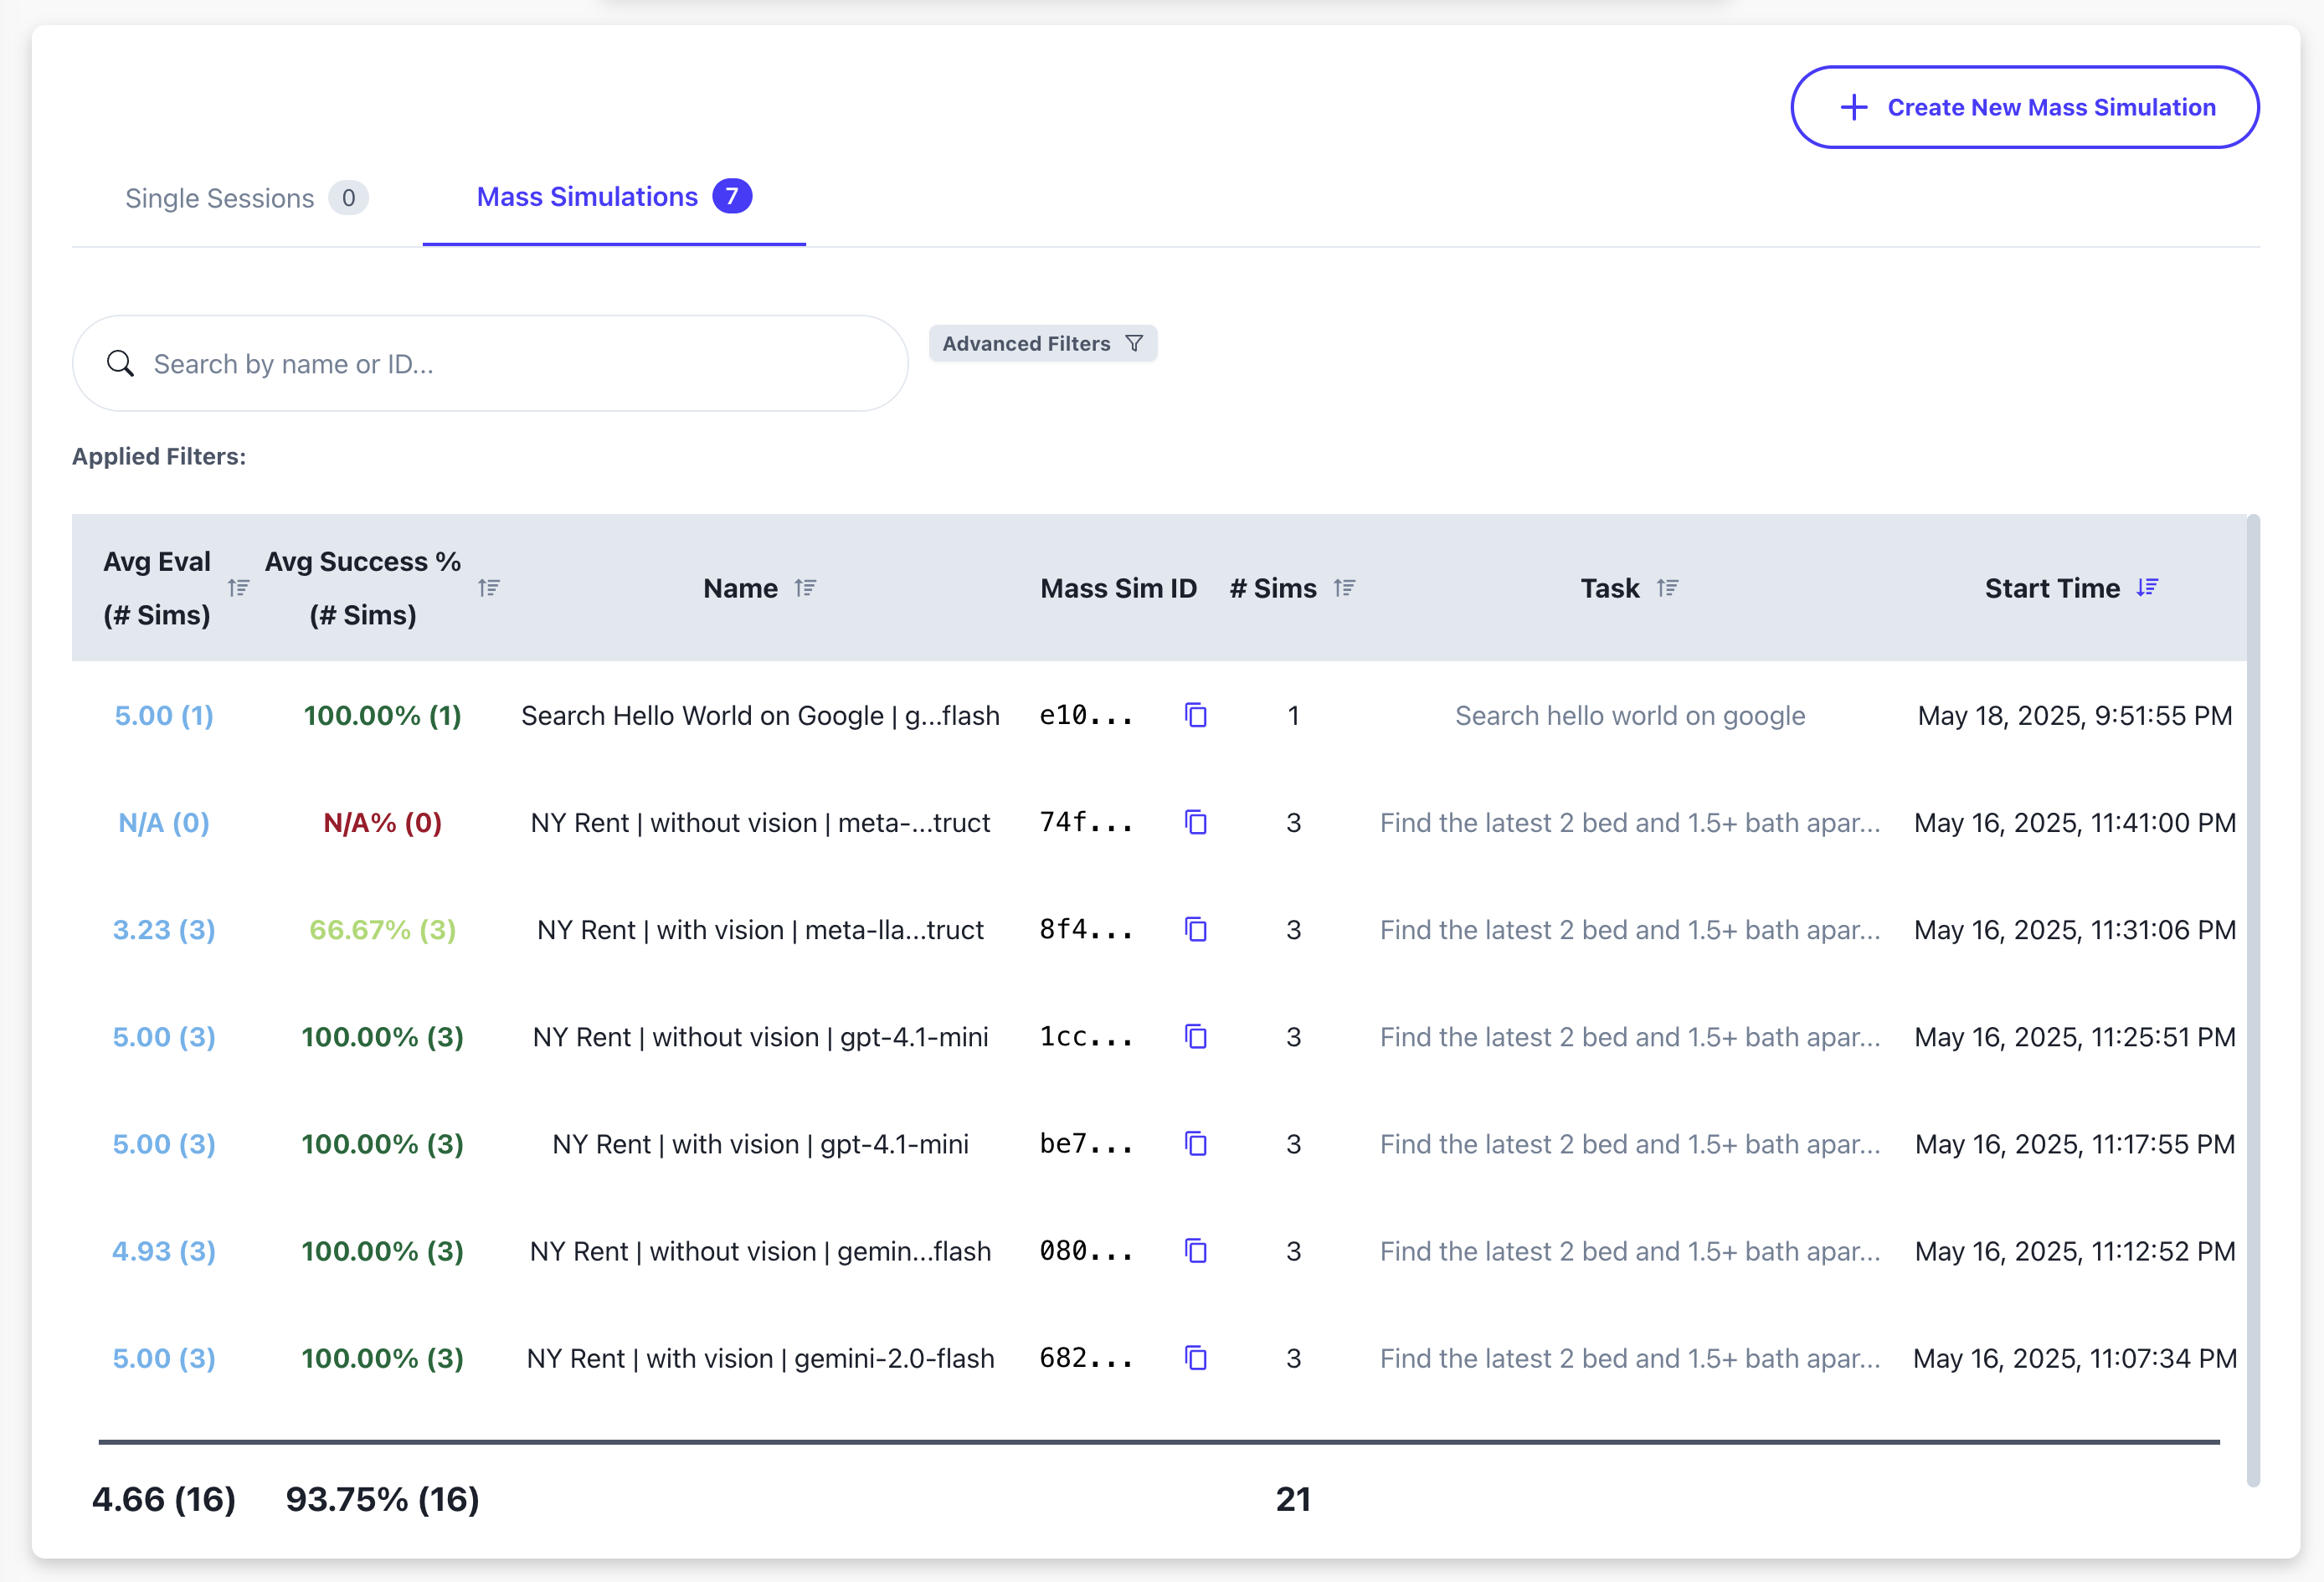
- You’ll be taken to the mass simulation analytics page
Key Features
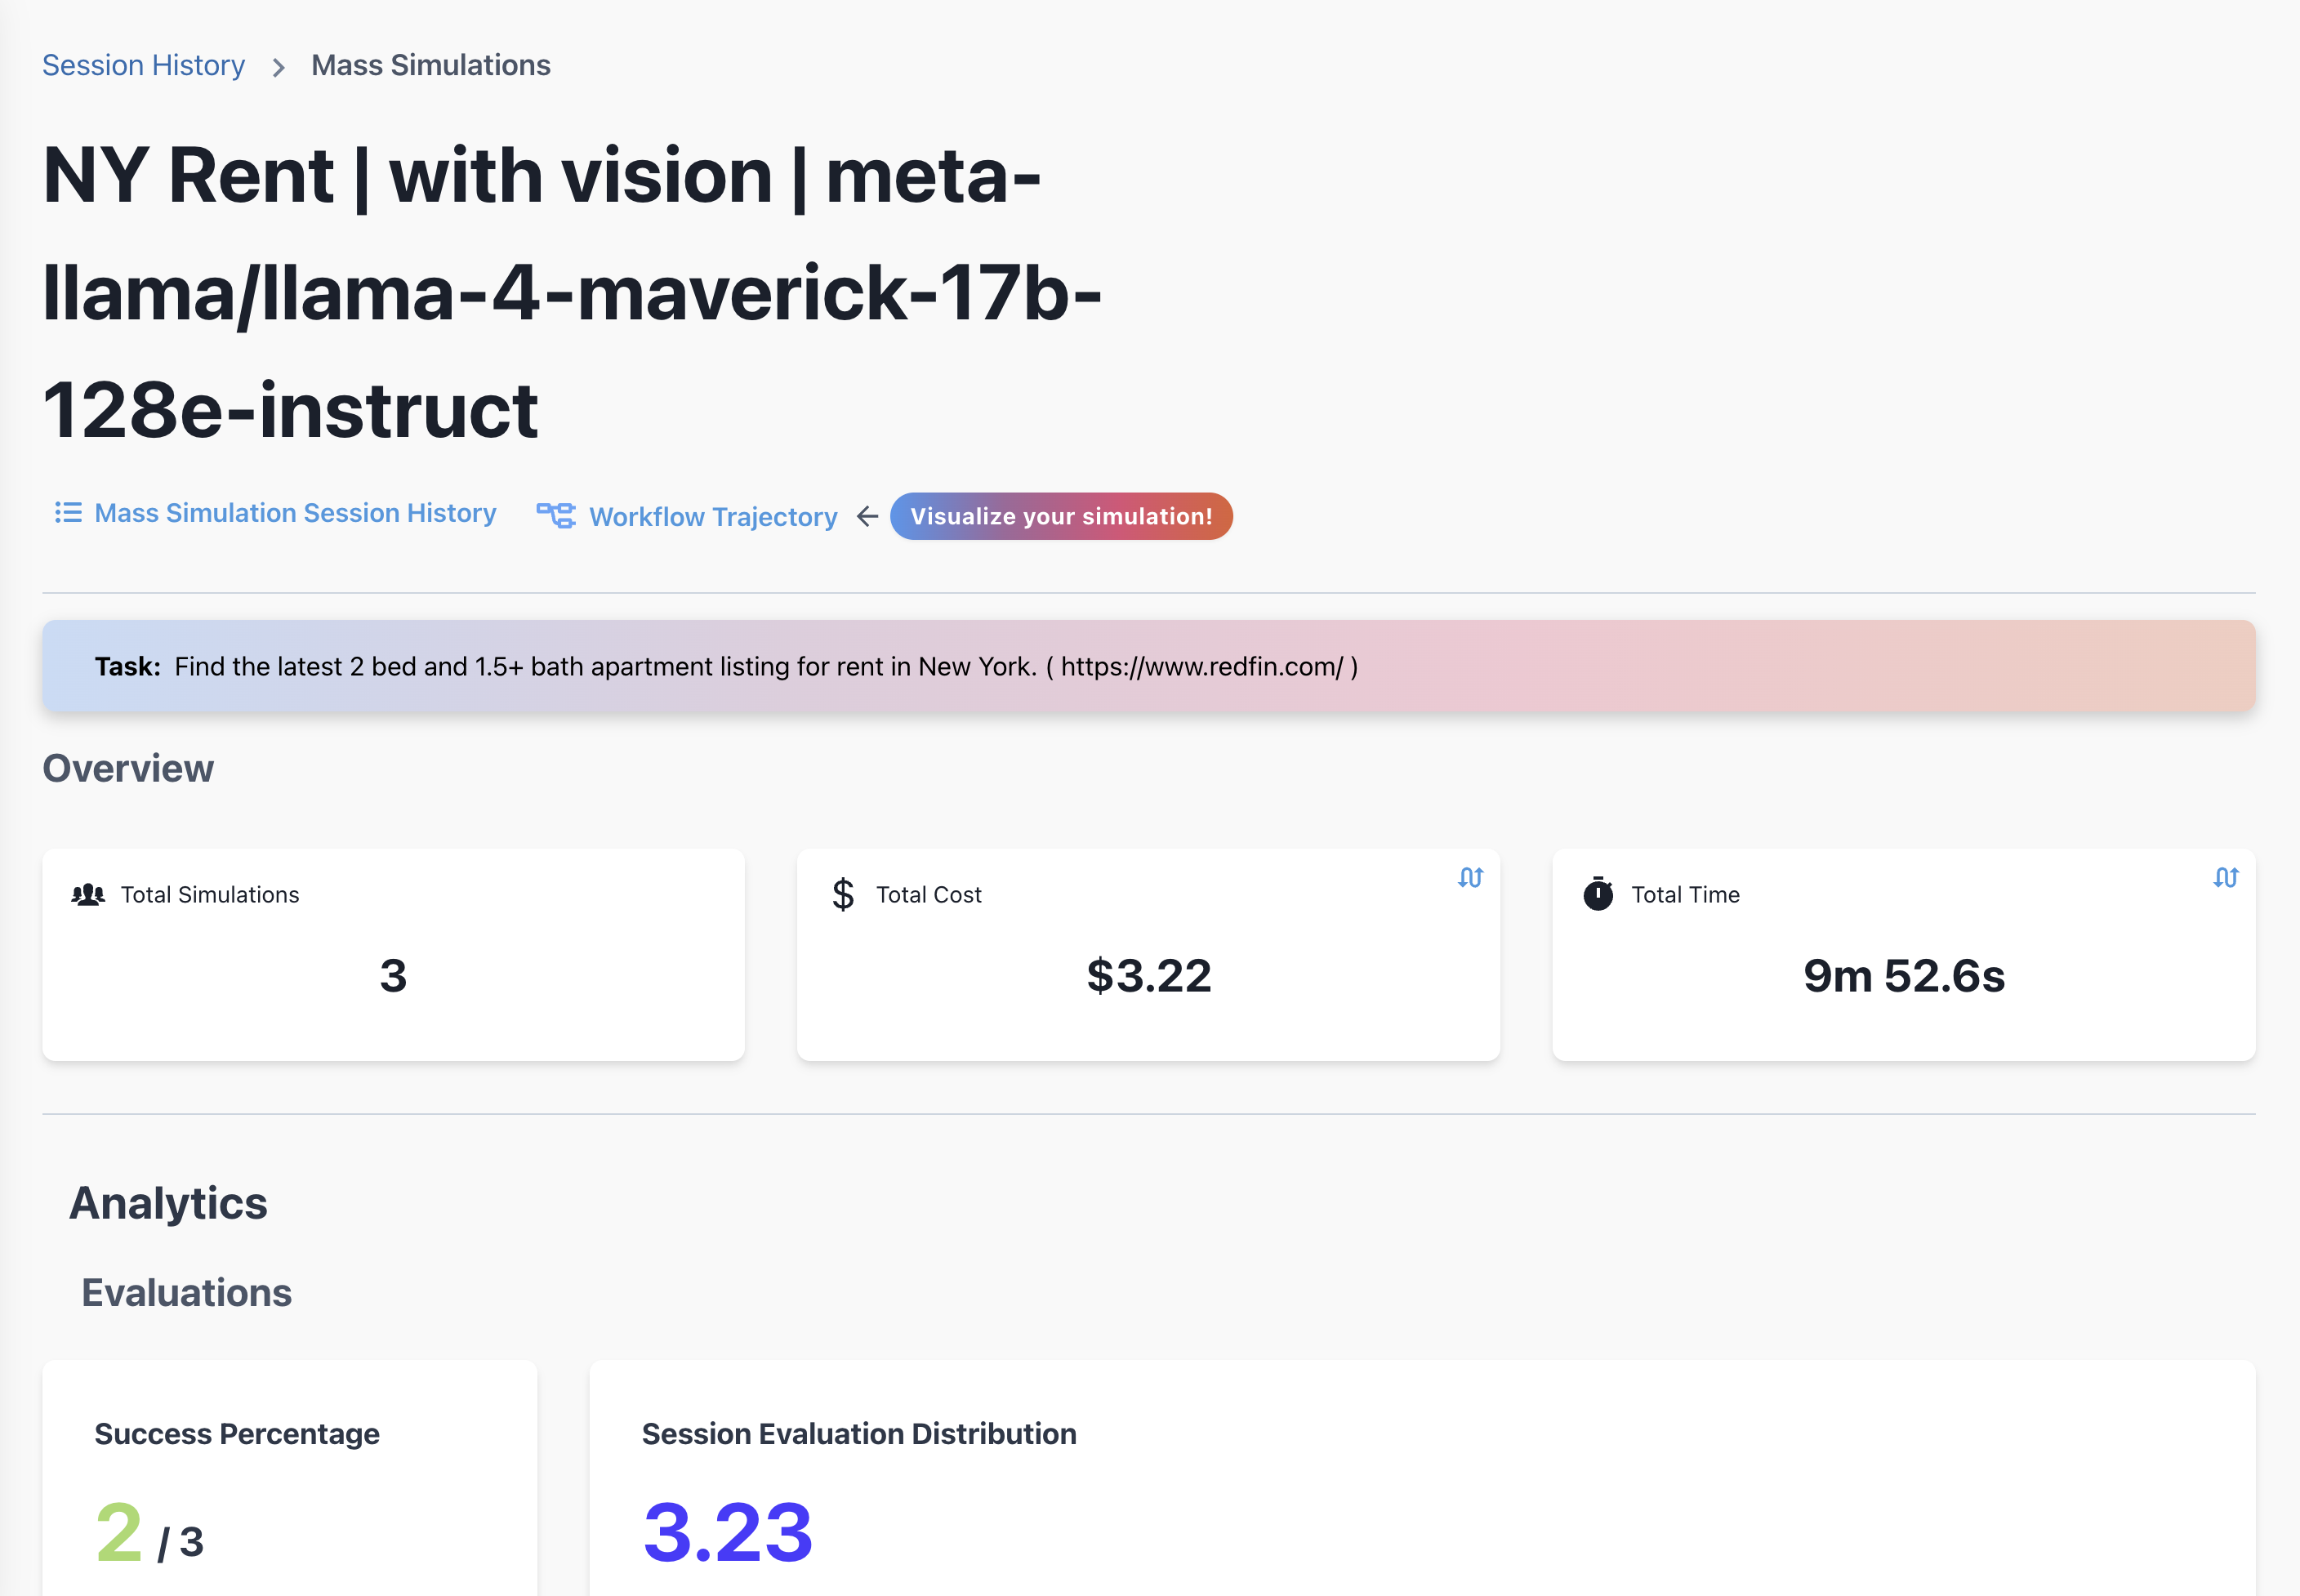
- Navigation Options - View all sessions in an analytics table or explore the Workflow Trajectory

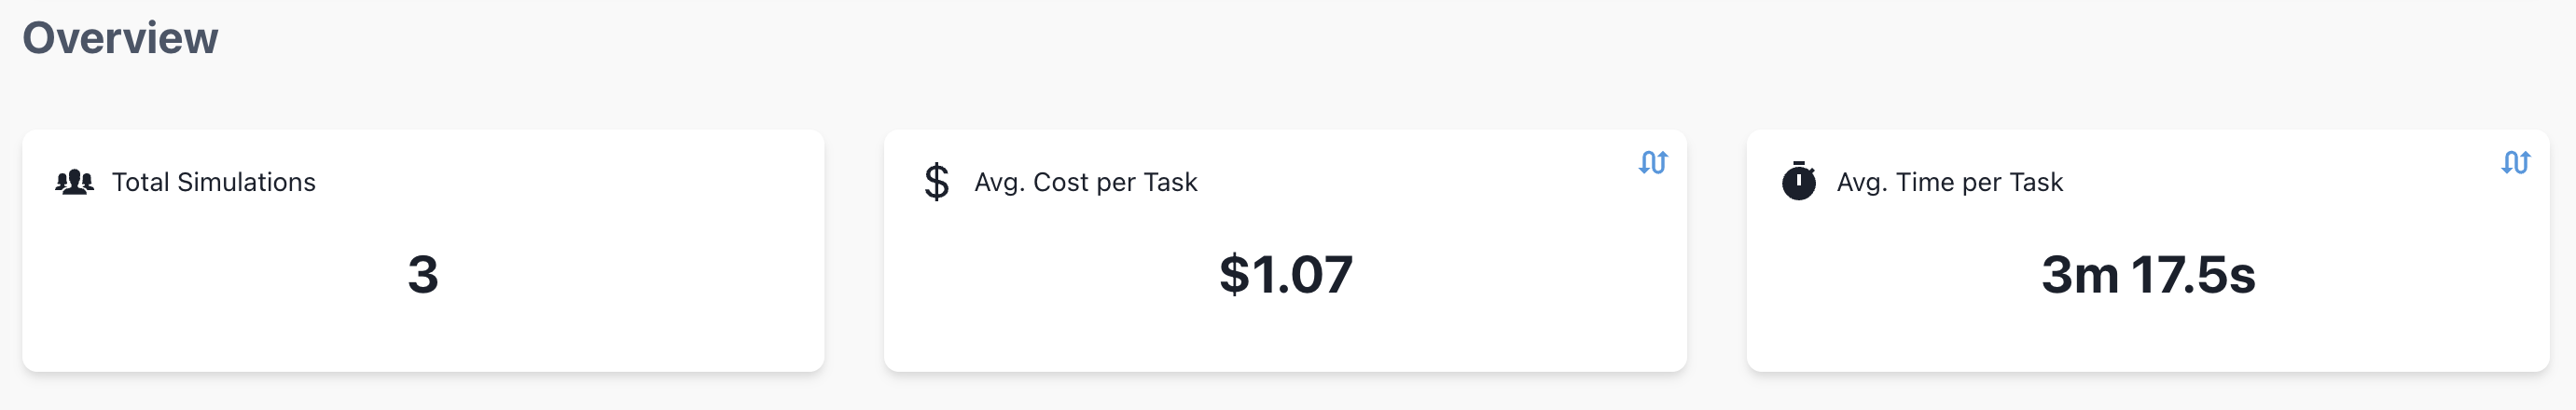
- Overview Statistics - See key metrics at a glance (click cards to flip)

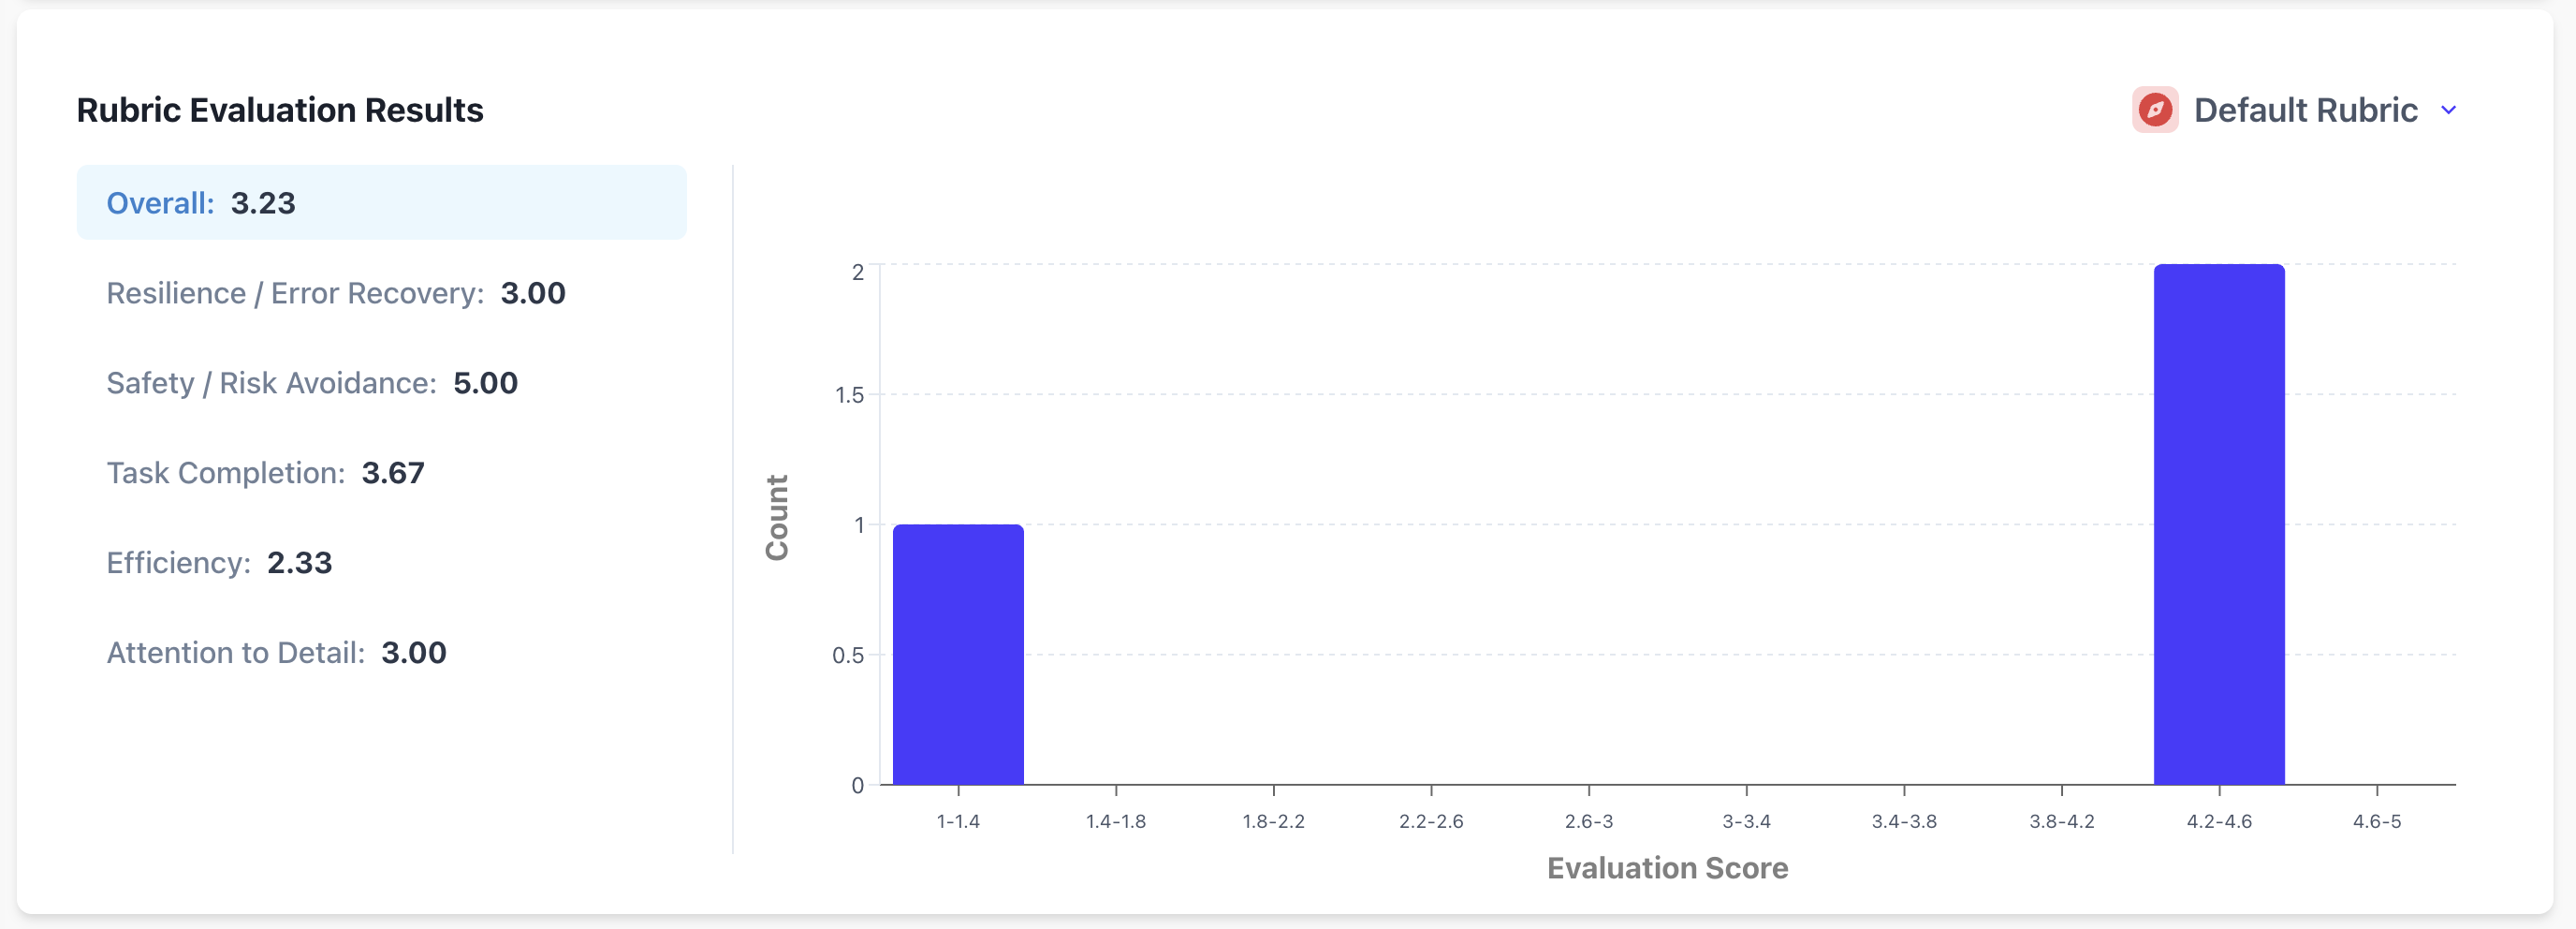
- Success Metrics - Track success percentage and evaluation distribution
Pro tip: Click on any eval in the bar charts to take you to the analytics table to take a closer look at which sessions received that eval.
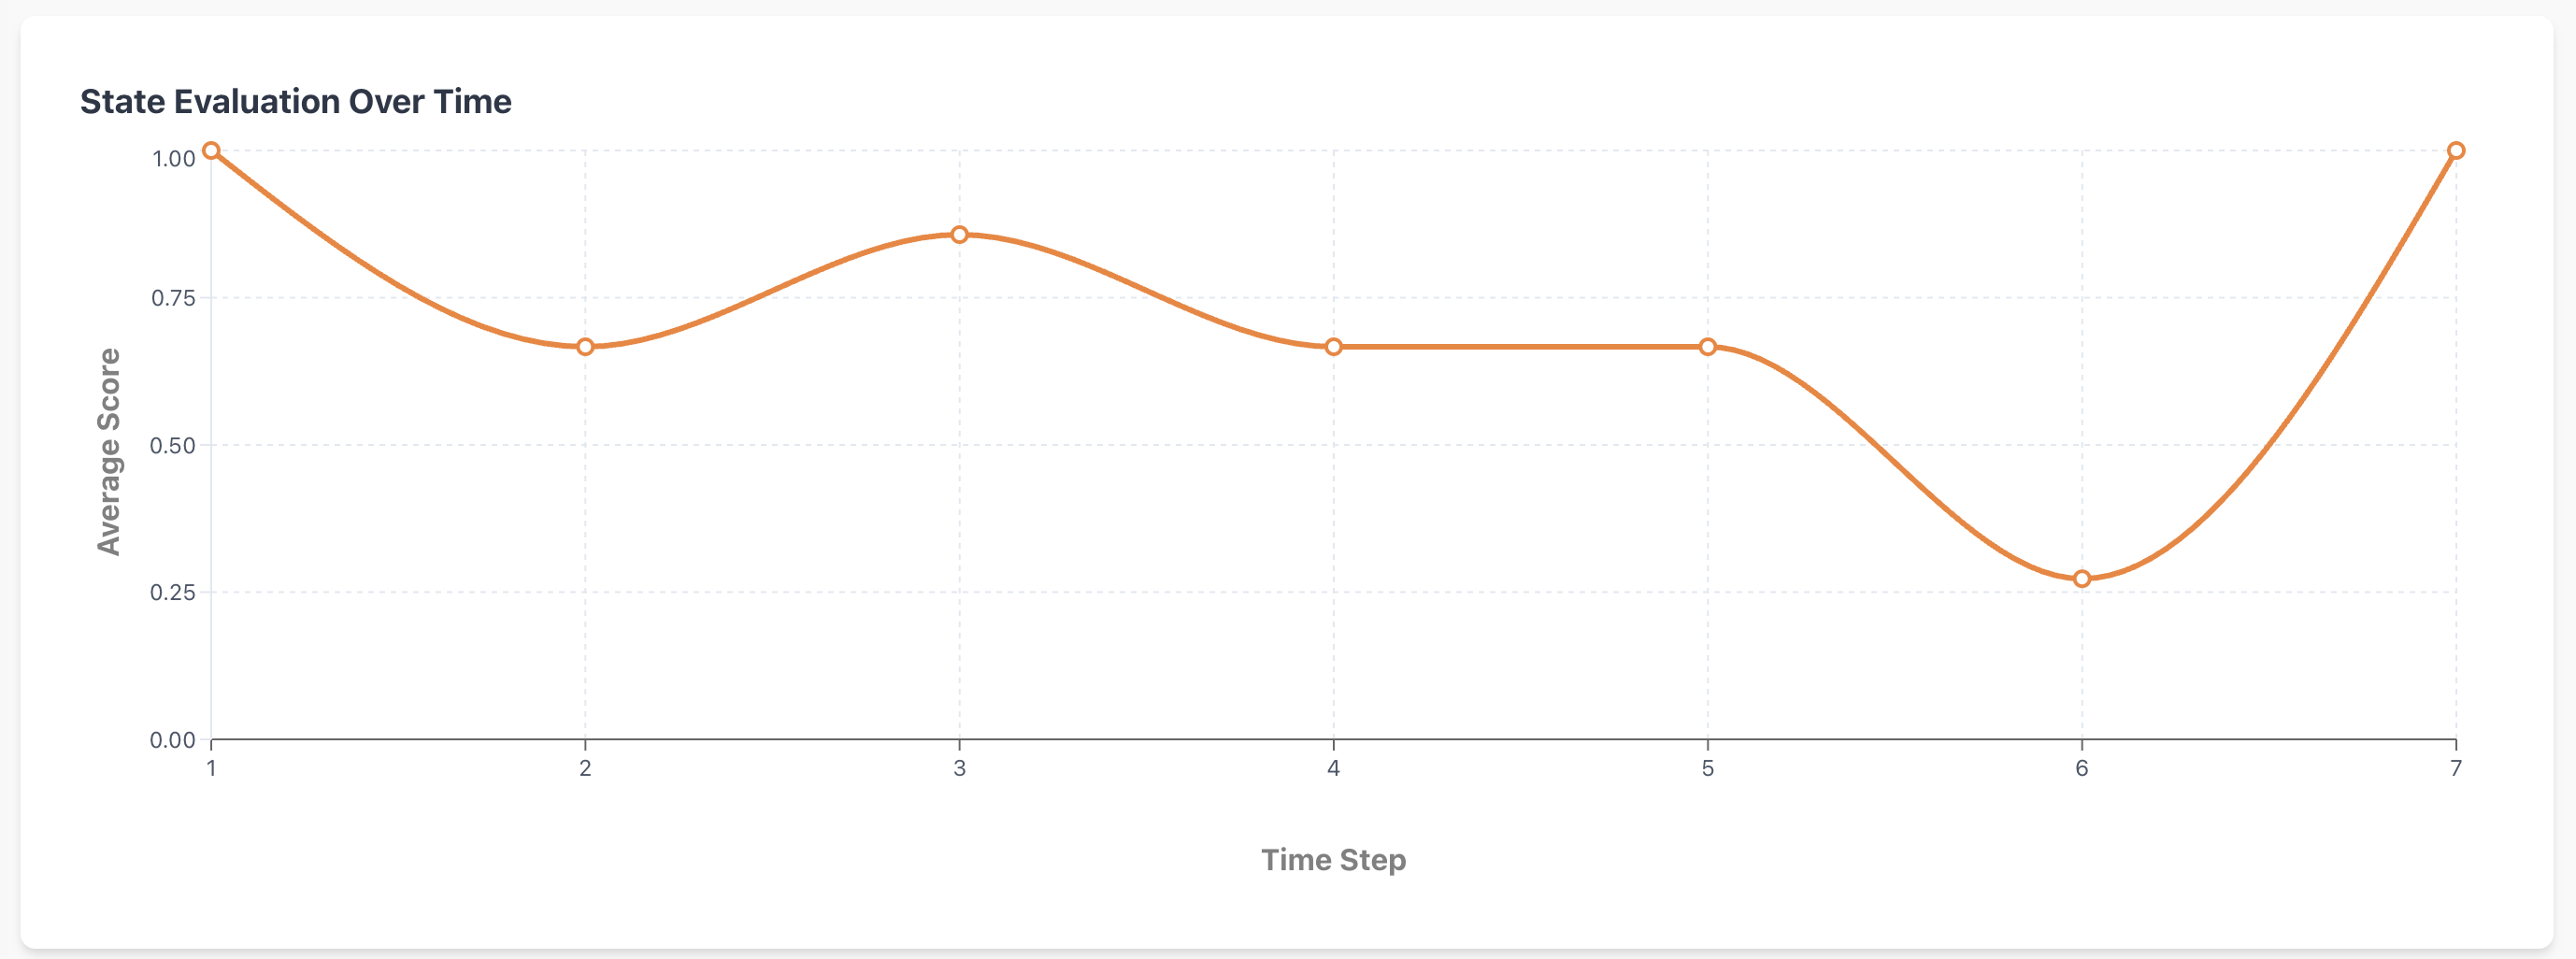
- Performance Over Time - See how your evaluation scores change across runs
- Rubric Breakdowns - Detailed evaluation across your custom criteria
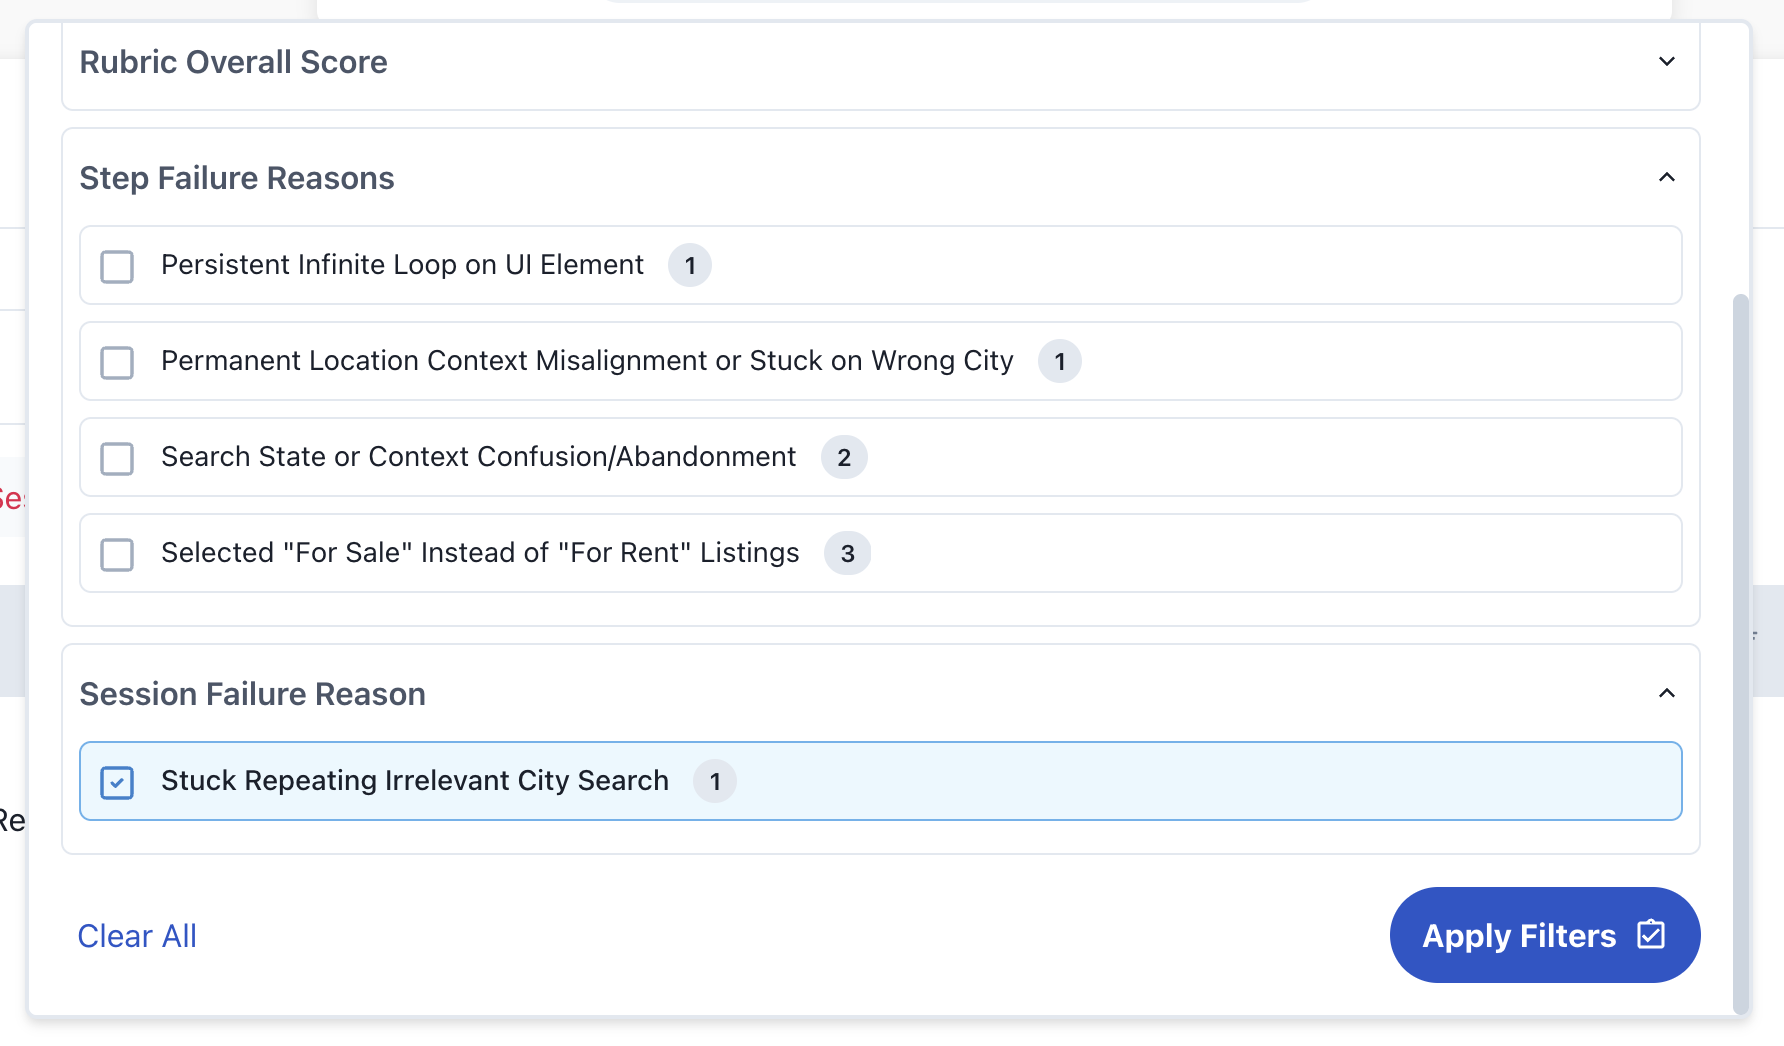
- Failure Analysis - Identify common session and step failure patterns
Pro tip: Click on any failure in the bar chart to take you to the analytics table to take a closer look at which sessions failed with that failure reason.
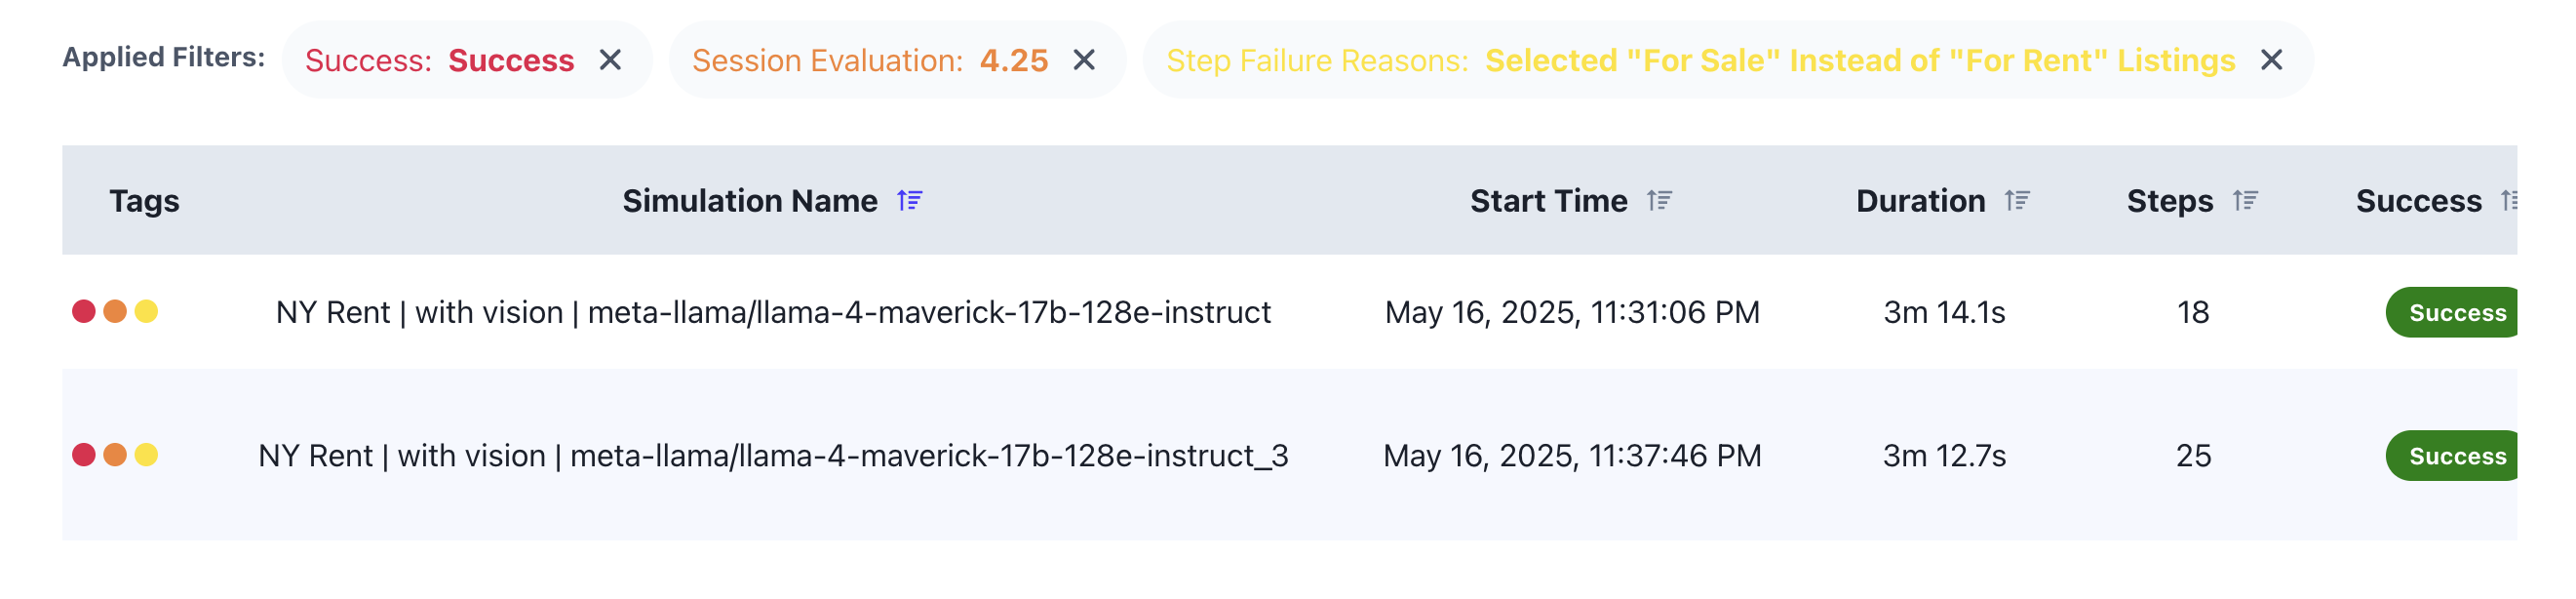
Interactive Analysis
- Click on charts to filter and explore specific subsets of your data in more detail

- Apply custom filters to analyze sessions by specific criteria

- Click any session to view it in detail in the Workflow Sandbox