Production Monitoring
Production Monitoring enables you to track and analyze your AI agents’ performance in real-world production environments, providing critical insights into cost, reliability, and user experience. Instead of flying blind in production, you get comprehensive visibility into how your agents perform with real users and data.Why Use Production Monitoring?
Production is different from development — real users, real data, real stakes. Production Monitoring helps you:- Track costs and resource usage in real-time
- Identify and diagnose production errors quickly
- Monitor performance degradation before users complain
- Establish baselines for normal behavior
- Detect anomalies and unusual patterns
- Prove ROI with detailed cost analytics
Use Cases
- Cost Management: Track token usage and API costs per session
- Error Tracking: Catch and diagnose failures before they impact users
- Performance Monitoring: Ensure response times meet SLAs
- Capacity Planning: Understand usage patterns and scale appropriately
- Compliance: Audit agent behavior for safety and policy adherence
Enabling Production Monitoring
Step 1: In Your Code
Enable production monitoring when initializing sessions:Step 2: In the Dashboard
Navigate to your agent and click the “Production” tab to access the monitoring dashboard.Understanding the Dashboard
Overview Metrics
The top of the dashboard displays real-time KPIs: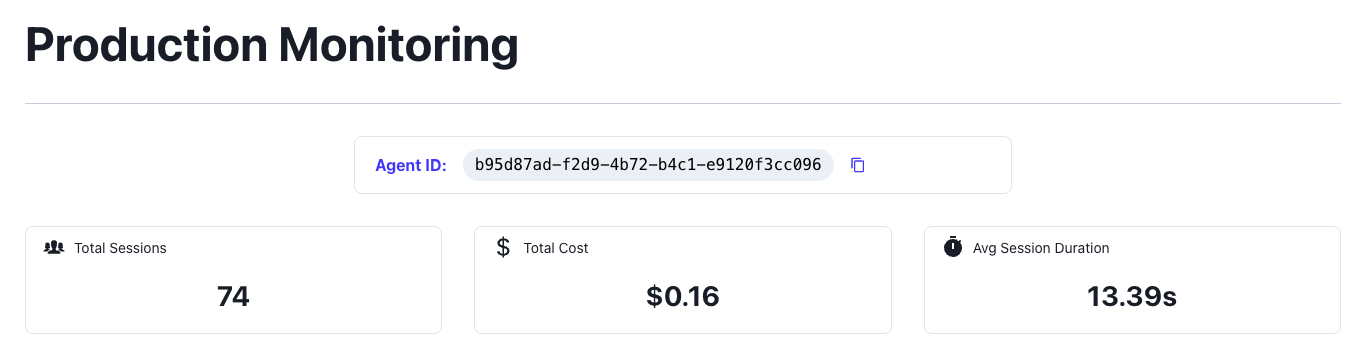
- Total Sessions: Count of production sessions in selected timeframe
- Average Duration: Mean session execution time
- Total Cost: Aggregate spend across all sessions
Cost Analysis
Track and optimize your AI spending: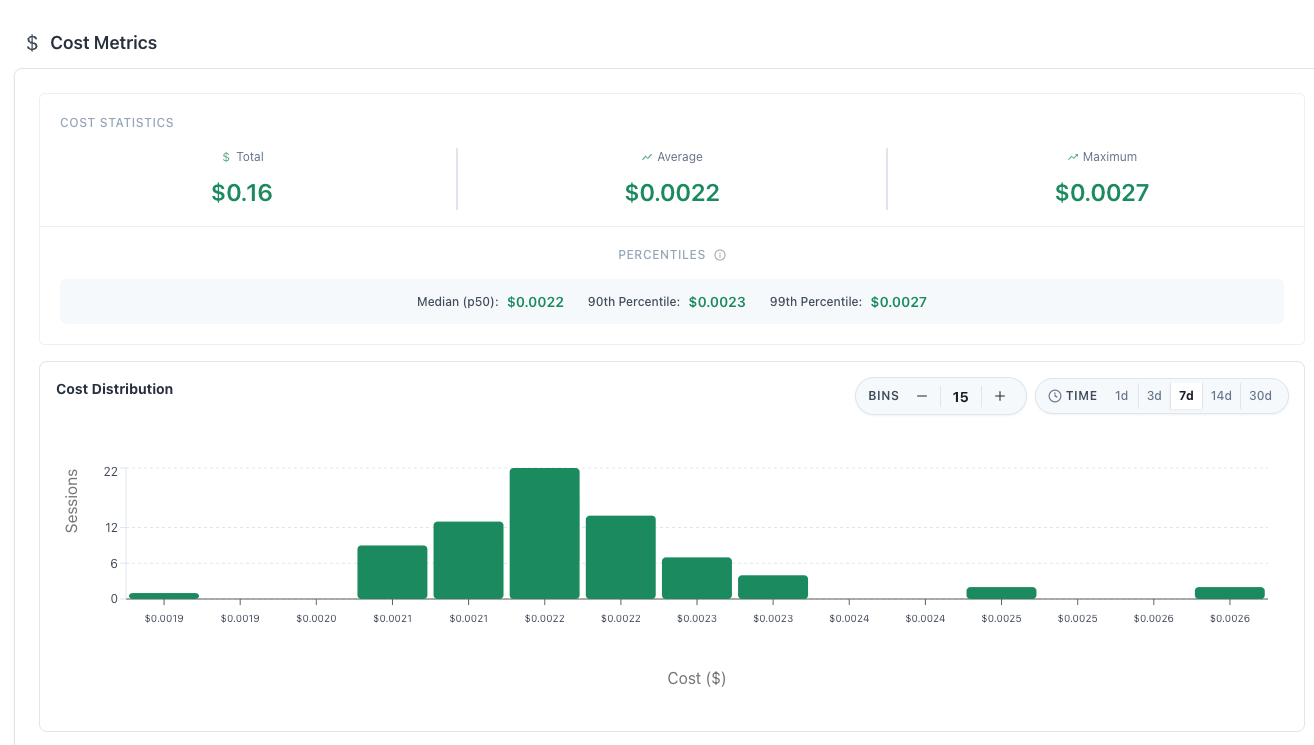
- By Time: 1 day, 3 day, 1 week, 2 week, and 1 month metrics
- By Percentiles: Median, 90th percentile, and 99th percentile cost breakdown
- Identify expensive outlier sessions
- Find opportunities to use cheaper models
- Click into sessions that cost too much
Error Monitoring
Proactively catch and fix production issues in the errors tab: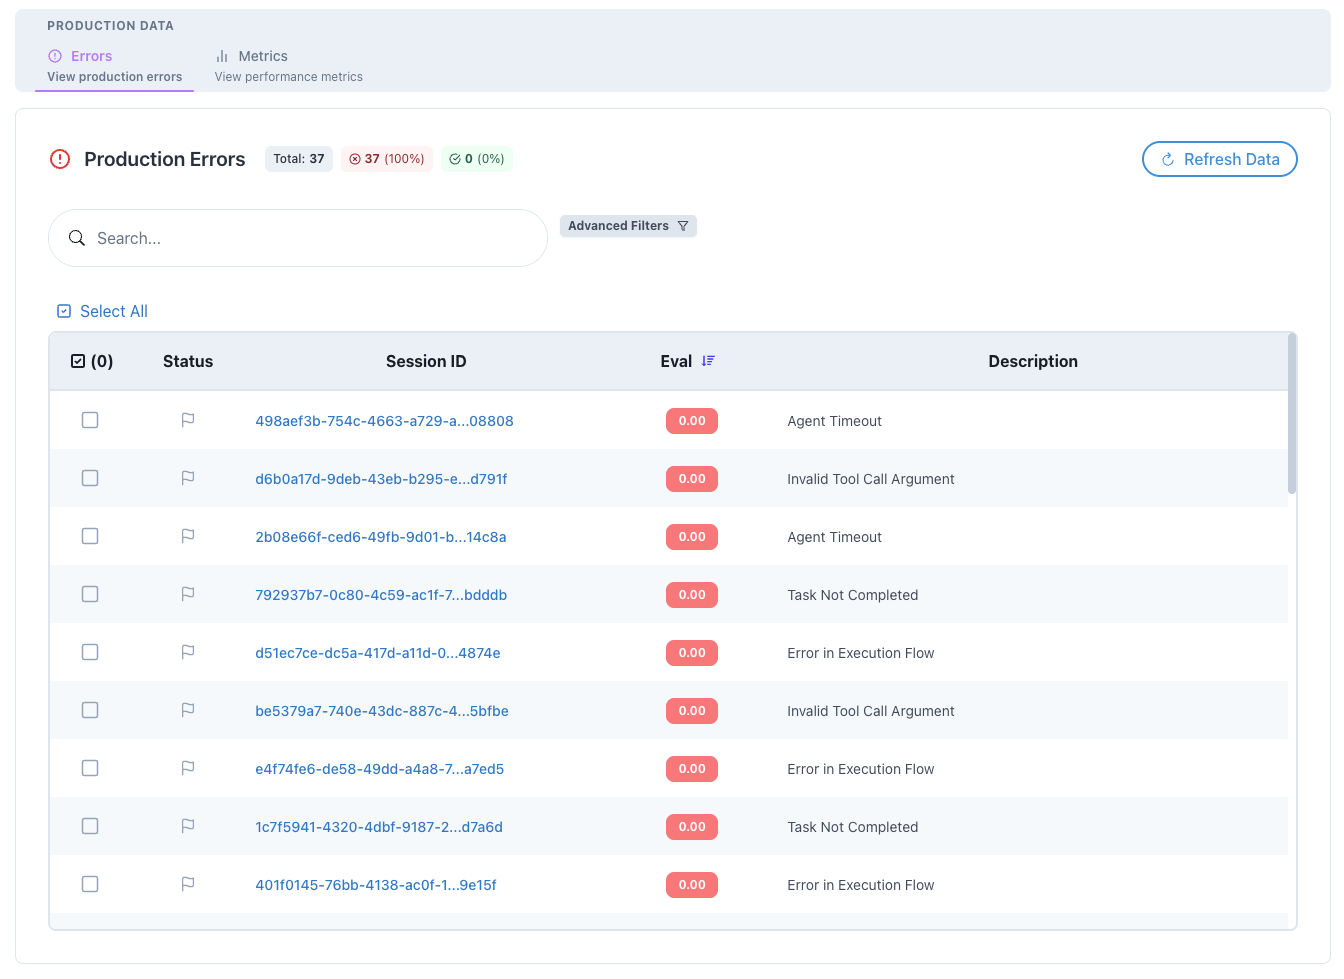
- Error Types: Categorized by type (timeout, API, validation)
- Error Messages: Full error details and stack traces
- Affected Sessions: Direct links to problematic sessions
Monitor latency:
Monitor time taken for each session to finish to catch outliers in execution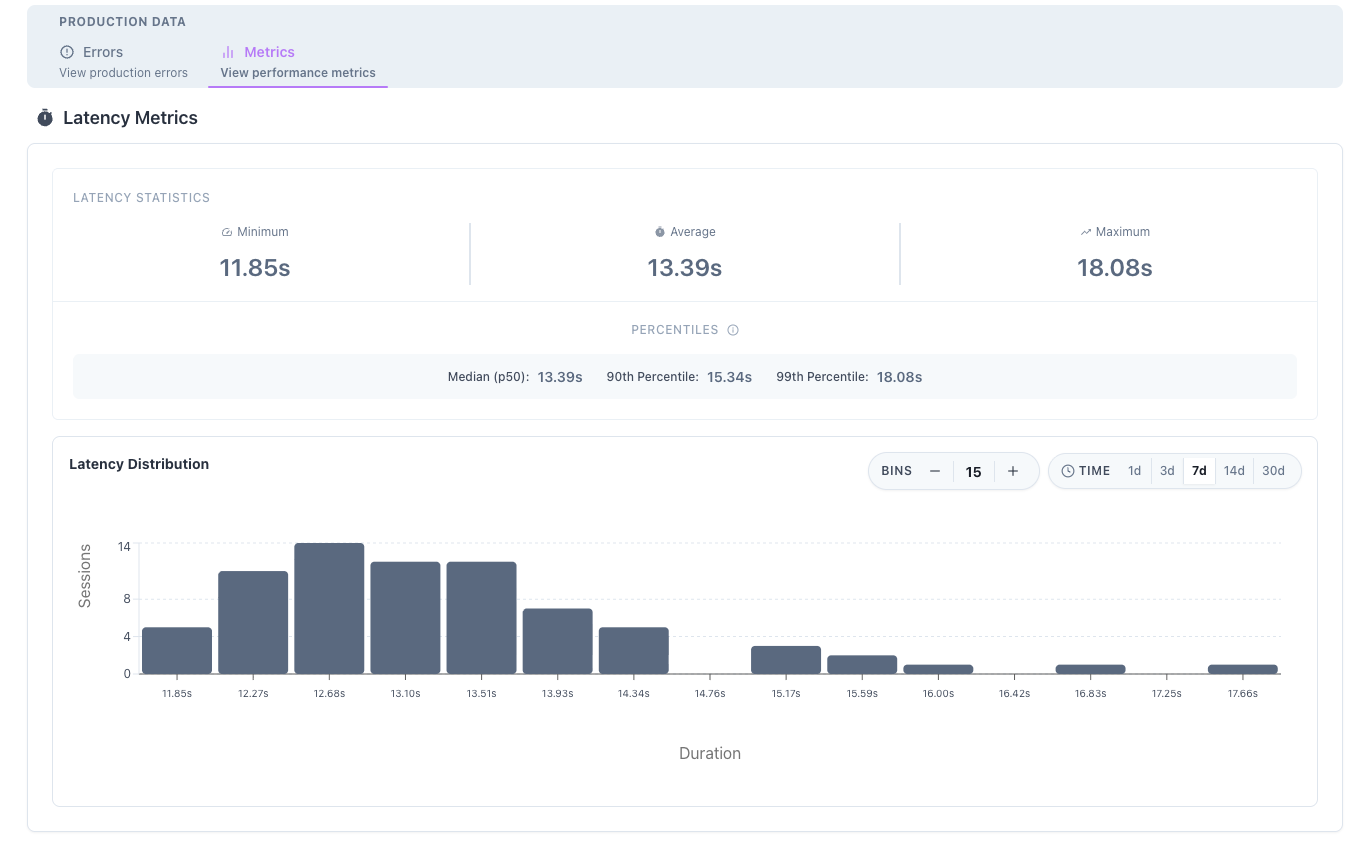
- Response Time Distribution: P50, P95, P99 latencies
- Event Duration: Time spent in each workflow event
- Set thresholds for key metrics
- Get notified of degradations
- Automatic anomaly detection
Filtering and Analysis
Time Range Selection
Choose from preset ranges or custom dates:- Last 24 hours
- Last 3 days
- Last 7 days
- Last 30 days
Comparison Views
Compare different time periods or segments:- Week-over-week changes
- Before/after deployments
- A/B test variants
- User cohorts
Session Deep Dives
Click any session from the monitoring dashboard to investigate: Session Details Include:- Complete execution timeline
- All LLM calls with prompts/responses
- Token usage per call
- Cost breakdown
- Error details and stack traces
- Performance waterfall chart
- Time Travel to replay sessions
- Export session data for offline analysis
Establishing Baselines
Creating Performance Baselines
-
Collect Initial Data
- Run in production for 1-2 weeks
- Ensure representative traffic
- Include peak and off-peak periods
-
Calculate Baselines
- Average session duration
- Typical cost per session
- Normal error rate
- Expected token usage
-
Set Thresholds
- Define acceptable ranges
- Configure alerts (when available)
- Document expected variations
Using Baselines
Monitor deviations from baseline to detect:- Performance regressions after updates
- Unusual user behavior patterns
- System degradation over time
- Cost increases from prompt changes
Best Practices
Production Monitoring Setup
Start Small- Enable for a subset of users first
- Gradually increase monitoring coverage
- Validate data accuracy
Cost Optimization
Monitor Regularly- Daily cost reviews during rollout
- Weekly trending analysis
- Monthly budget reconciliation
- Identify most expensive operations
- Consider model downgrades where appropriate
- Cache repeated operations
- Batch similar requests
Error Management
Categorize Errors- User errors vs system errors
- Recoverable vs fatal
- Expected vs unexpected
- Document common errors
- Define resolution steps
- Assign ownership
- Time to detection
- Time to resolution
- Recurrence prevention
Performance Monitoring
Define SLAs- Set clear performance targets
- Monitor compliance
- Report on violations
- Focus on P95/P99 latencies
- Address slowest operations first
- Consider async processing
Integration with Other Features
With Experiments
Compare production performance to experiments:With Rubrics
Apply evaluation rubrics to production sessions:With Mass Simulations
Use production data to inform simulations:- Identify common production scenarios
- Create mass simulations based on real patterns
- Test changes before production deployment
API Access
Query production metrics programmatically:Troubleshooting
Common Issues
Sessions not appearing in production view- Verify
production_monitoring=Trueis set - Check session has completed
- Refresh the dashboard
- Ensure correct time range selected
- Verify timezone settings
- Check filter configuration
- Clear browser cache
- Contact support if persists
- Review error retry logic
- Check for infinite loops
- Audit model selection
- Review prompt templates
Advanced Configuration
Environment-Specific Monitoring
Custom Monitoring Policies
Related Features
- Experiments - Compare production to test variants
- Rubrics - Evaluate production quality
- Time Travel - Replay production sessions
Next Steps
- Enable production monitoring in your code
- Run for a week to establish baselines
- Set up regular monitoring reviews
- Optimize based on insights
- Share reports with stakeholders