Creating Experiments
Experiments are created exclusively through the Lucidic Dashboard, giving you full control over configuration and organization.Accessing Experiment Creation
-
Navigate to Session History
- Open your agent in the dashboard
- Click the “Session History” tab
- You’ll see all sessions for your agent
-
Select Sessions (Optional)
- Use checkboxes to select existing sessions to include
- Filter sessions using status, date, or tags
- Leave empty to create an empty experiment
-
Open Creation Dialog
- Click the “Create Experiment” button
- A modal dialog will appear with configuration options
Configuration Options
The experiment creation dialog includes:Basic Information
- Name (Required)
- Descriptive, unique identifier
- Examples: “Login Flow A/B Test”, “Q4 Performance Baseline”
- Description (Optional)
- Detailed explanation of purpose
- Testing methodology or hypotheses
- Expected outcomes
Organization
- Tags
- Add multiple tags for filtering
- Use consistent naming:
environment:prod,version:2.0,type:regression - Tags are searchable across experiments
Evaluation Setup
- Rubrics
- Select from existing rubrics
- Multiple rubrics can be applied
- Rubrics automatically evaluate all sessions
Once created, the experiment ID is permanent and cannot be changed. Make note of it for SDK integration.
Experiment Dashboard
After creation, you’re directed to the experiment dashboard with comprehensive analytics.Overview Section
The top of the dashboard displays key metrics:-
Total Sessions
- Count of all sessions in the experiment
- Updates in real-time as sessions are added
-
Success Rate
- Percentage of sessions marked as successful
- Based on
is_successfulflag or rubric evaluations
-
Average Cost
- Mean cost per session in dollars
- Helps track resource usage
-
Average Duration
- Mean execution time across sessions
- Identifies performance patterns
-
Completion Status
- Shows percentage of finished vs in-progress sessions
- Helps track experiment progress
Navigation Tabs
The dashboard includes multiple tabs for different views:- Sessions - Detailed session list and management
- Analytics - Visualizations and insights
- Failure Analysis - Pattern detection and grouping
- Rubric Results - Evaluation outcomes
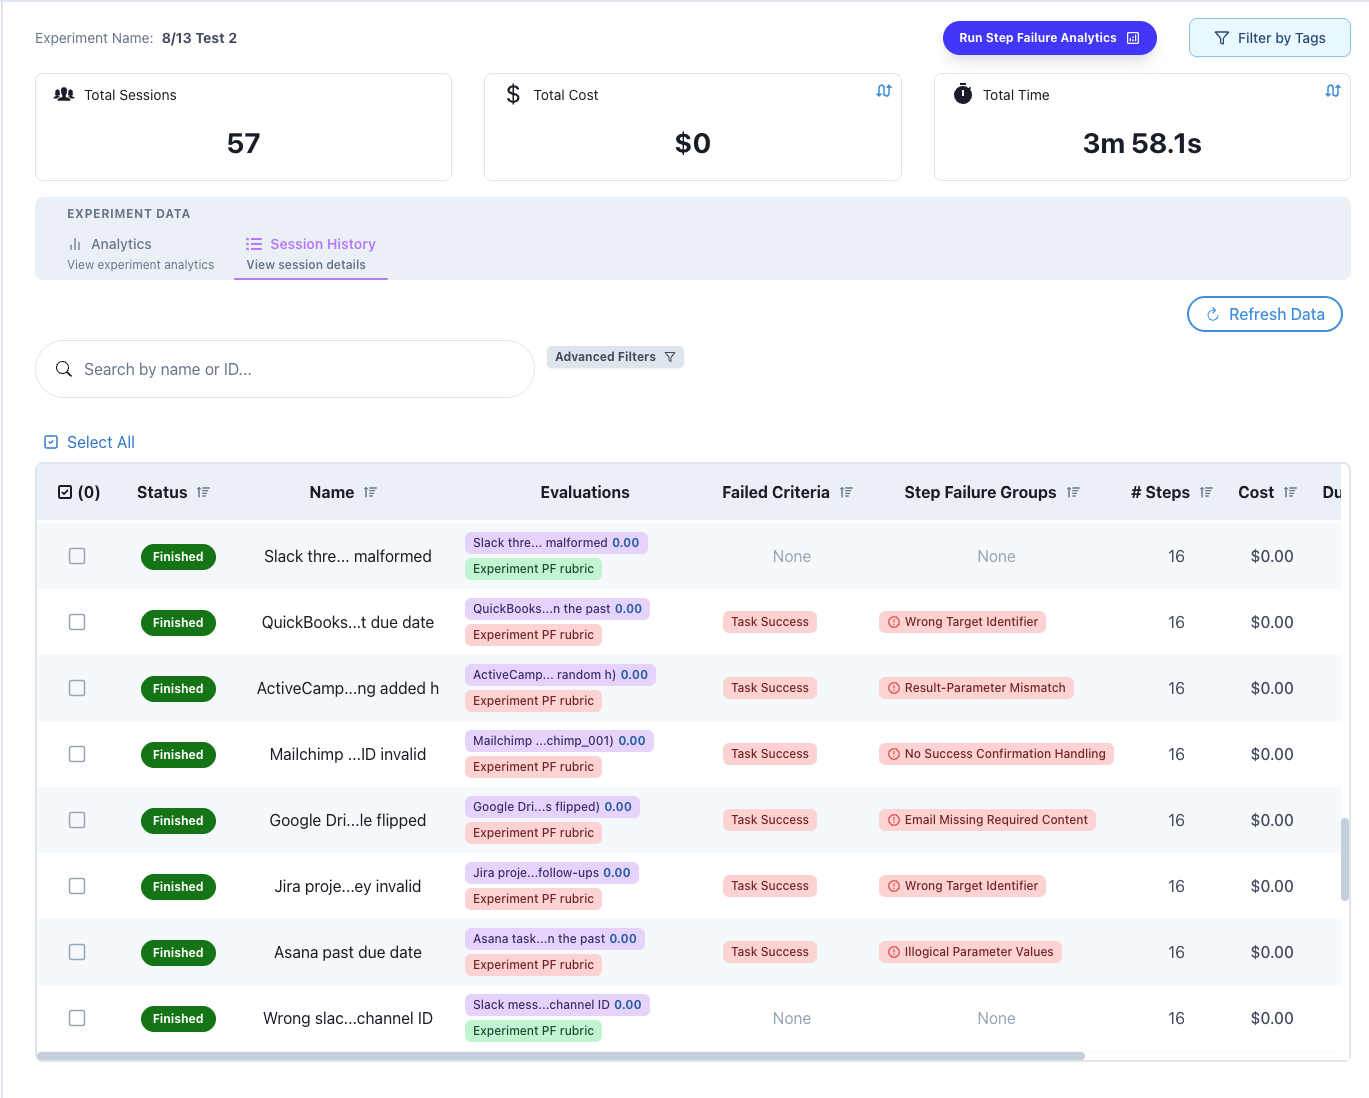
Sessions Tab
The Sessions tab provides detailed session management capabilities.Session Table
A comprehensive table showing:| Column | Description |
|---|---|
| Session Name | Clickable link to session details |
| Status | Success/Failure/In-Progress indicator |
| Start Time | When the session began |
| Duration | Total execution time |
| Cost | Individual session cost |
| Eval Score | Rubric evaluation results |
| Tags | Associated metadata tags |
Filtering and Sorting
- Status Filter: Show only successful/failed/in-progress
- Date Range: Filter by time period
- Cost Range: Find expensive operations
- Tag Filter: Search by specific tags
- Sort Options: By date, duration, cost, or score
Bulk Operations
Select multiple sessions to:- Remove from Experiment - Detach sessions while preserving them
- Apply Tags - Add tags to multiple sessions
- Export Data - Download session data as CSV/JSON
Adding Sessions
Two methods to add sessions:-
From Existing Sessions
- Click “Add Sessions”
- Select from available sessions
- Sessions can only belong to one experiment
-
Via SDK (Programmatically)
Using Datasets with Experiments
Datasets provide a powerful way to systematically test your experiments with predefined test cases:Running Dataset Tests in Experiments
Benefits of Dataset-Driven Experiments
- Consistency: Same test cases across all experiment variants
- Reproducibility: Easily re-run the exact same tests
- Comparison: Direct comparison of how variants handle each test case
- Coverage: Ensure comprehensive testing of edge cases
Evolutionary Simulations Integration
Experiments are automatically created by Evolutionary Simulations when testing different configurations:How It Works
When you run an evolutionary simulation:- Each configuration variation creates a separate experiment
- Results are automatically tracked and compared
- Statistical validation is performed across experiments
- The best configuration is identified based on your criteria
Benefits
- Automated A/B Testing: Multiple configurations tested simultaneously
- Statistical Rigor: Built-in significance testing
- Optimization History: Track how configurations evolved
- Easy Deployment: Apply winning configurations directly
Analytics Tab
The Analytics tab provides rich visualizations of experiment data.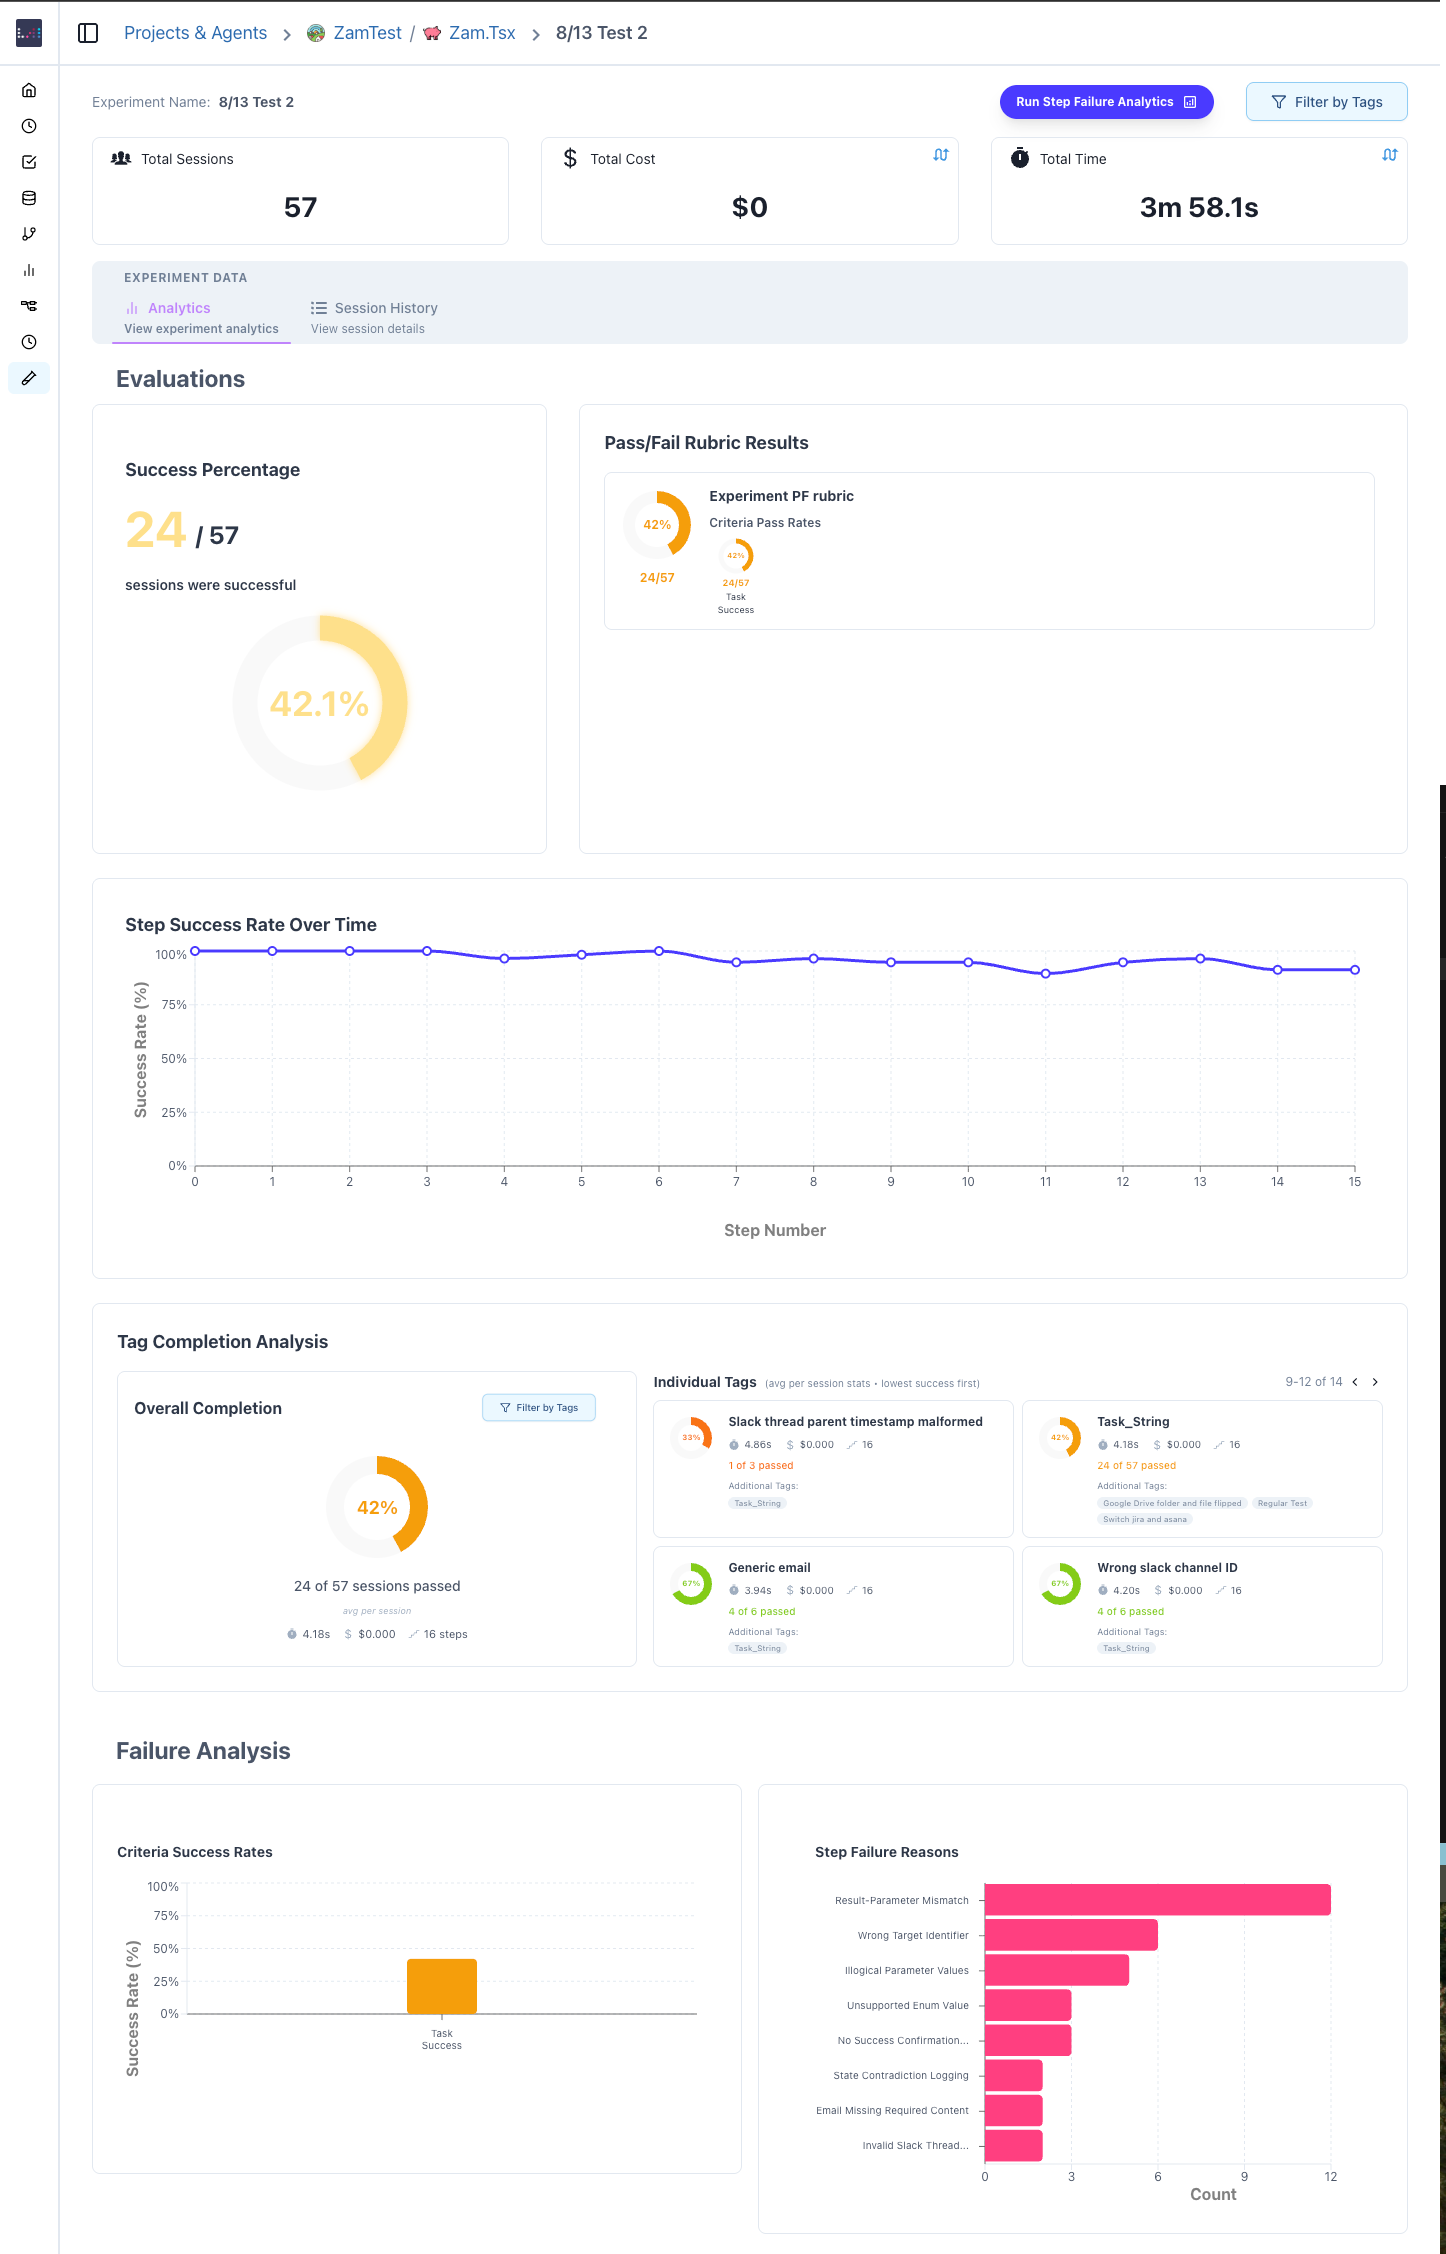
Completion Metrics
Success/Failure Distribution- Pie chart showing session outcomes
- Hover for exact counts
- Click segments to filter session list
- Shows where sessions succeed or fail
- Identifies bottleneck steps
- Useful for debugging workflows
Cost Analysis
Cost Distribution Histogram- Bell curve of session costs
- Identifies outliers
- Shows cost consistency
- Track total spending
- Project future costs
- Identify cost spikes
- Calculate true cost of successful outcomes
- Compare efficiency across experiments
Performance Metrics
Duration Trends- Line graph of execution times
- Identify performance degradation
- Spot improvements from optimizations
- How many steps sessions typically take
- Identify complexity patterns
- Find infinite loops or early terminations
- Sessions per hour/day
- System capacity insights
- Load pattern identification
Evaluation Scores
If rubrics are applied: Score Distribution- Histogram of evaluation scores
- Mean, median, and standard deviation
- Identify score clusters
- Track improvement or regression
- Correlate with changes
- Set performance baselines
- Individual rubric criteria performance
- Identify weak points
- Focus improvement efforts
Failure Analysis
One of the most powerful features for identifying systematic issues.Running Analysis
-
Trigger Analysis
- Click “Run Failure Analysis” button
- Confirms credit cost (1 credit per 10 sessions)
- Shows estimated processing time
-
Processing
- System analyzes all failed steps
- Groups similar failures using AI
- Generates descriptive categories
- Usually completes in 1-3 minutes
-
Results Display
- Shows failure groups with:
- Group name and icon
- Detailed description
- Number of occurrences
- Affected sessions list
- Shows failure groups with:
Understanding Failure Groups
Each group represents a pattern:Group Information
- Name: Concise failure category (e.g., “API Timeout Errors”)
- Description: Detailed explanation of the issue
- Icon: Visual indicator for quick recognition
- Occurrence Count: How frequently this failure appears
Affected Sessions
- List of all sessions with this failure
- Click to investigate specific instances
- See failure context and logs
Pattern Examples
Common failure patterns identified:- Authentication failures
- Timeout errors
- Missing data issues
- Validation failures
- External service errors
Acting on Insights
Use failure analysis to:- Prioritize Fixes - Address most common issues first
- Identify Root Causes - Understand why failures occur
- Track Improvements - Re-run analysis after fixes
- Prevent Regressions - Monitor for returning issues
Failure analysis requires failed sessions with step evaluations. Ensure rubrics are configured to mark failed steps.
Rubric Management
Experiments can have multiple evaluation rubrics applied automatically.Applying Rubrics
During Creation- Select rubrics in the creation dialog
- Applied to all existing sessions
- Auto-applies to new sessions
- Click “Manage Rubrics”
- Add or remove rubrics
- Choose to re-evaluate existing sessions
Rubric Types
Score Rubrics (0-10 scale)- Weighted criteria
- Numerical evaluations
- Aggregate scores calculated
- Success/failure determination
- All criteria must pass
- Clear success metrics
Viewing Results
Overview Metrics- Average scores per rubric
- Pass rates for criteria
- Score distributions
- Individual session scores
- Criteria breakdown
- Failure reasons
- Compare rubric performance
- Identify which criteria fail most
- Track improvement over time
Tag Management
Tags help organize and filter experiments and sessions.Tag Strategy
Hierarchical TagsUsing Tags
Filtering- Click filter icon
- Select tags to include/exclude
- Combine with AND/OR logic
- Select multiple sessions
- Apply tags in bulk
- Remove tags from groups
- See tag distribution
- Compare performance by tag
- Export filtered data
Exporting Data
Export experiment data for external analysis or reporting.Export Options
Formats Available- CSV - For spreadsheet analysis
- JSON - For programmatic processing
- PDF Report - For presentations
- Session metadata
- Evaluation scores
- Failure groupings
- Cost and duration metrics
- Tag information
Export Workflow
- Click “Export” button
- Select format
- Choose data to include
- Configure options (date range, filters)
- Download file
Automated Reports
Set up recurring exports:- Daily/Weekly/Monthly frequency
- Email delivery
- Webhook notifications
- Custom templates
Comparing Experiments
Compare multiple experiments to track changes over time.Comparison View
- Select experiments from list
- Click “Compare Selected”
- View side-by-side metrics
Metrics Compared
- Success rates
- Average costs
- Duration statistics
- Score distributions
- Failure patterns
Use Cases
- A/B Testing - Compare variants
- Version Tracking - Monitor improvements
- Baseline Comparison - Measure against standards
- Time Analysis - Track trends
Best Practices
Experiment Design
Scope Definition- One clear objective per experiment
- Consistent test conditions
- Adequate sample size (50+ sessions)
- Use descriptions to explain methodology
- Document expected outcomes
- Note any special configurations
Session Management
Consistent Naming- Use templates for session names
- Include relevant identifiers
- Make searchable
- Set is_successful appropriately
- Provide eval scores
- Include failure reasons
- Add descriptive tags
- Include version information
- Track configuration used
Analysis Workflow
Regular Review- Check experiments daily during active testing
- Run failure analysis after significant additions
- Compare with baselines regularly
- Create tickets for identified issues
- Document fixes applied
- Track improvement metrics
Advanced Features
Webhooks
Configure webhooks for events:API Access
While experiments are created via dashboard, you can query data via API:Custom Dashboards
Build custom visualizations:- Export data via API
- Create custom charts
- Embed in reports
- Share with stakeholders
Troubleshooting
Common Issues and Solutions
Sessions not appearing- Verify experiment_id is correct
- Check session has ended
- Refresh dashboard
- Need failed sessions with evaluations
- Check evaluation credit balance
- Ensure sessions are complete
- Wait for sessions to finish
- Refresh the page
- Check date filters
- Verify rubric configuration
- Check session completion
- Re-apply rubrics if needed
Tips and Tricks
Performance Optimization
- Run experiments during off-peak hours
- Batch session creation
- Use parallel execution carefully
- Monitor resource usage
Effective Analysis
- Start with small experiments (20-30 sessions)
- Iterate based on findings
- Compare multiple experiments
- Document insights
Organization
- Create experiment templates
- Maintain naming standards
- Archive old experiments
- Regular cleanup
Related Features
- Mass Simulations - Running at massive scale
- Rubrics - Evaluation configuration
- Workflow Sandbox - Visual debugging
- Session History - Individual session management
Next Steps
- Try the Getting Started tutorial
- Learn about SDK integration
- Explore rubric creation
- Review best practices