Workflow Sandbox
The Workflow Sandbox is your deep-dive view into a single agent run — also known as a Session. Learn to create a session with our Quick Start guide. This is where observability meets usability: you can replay the session, inspect every step, explore the underlying events, and evaluate performance using rubrics — all in one place.To get here Click Project -> Agent -> any session in the session history.
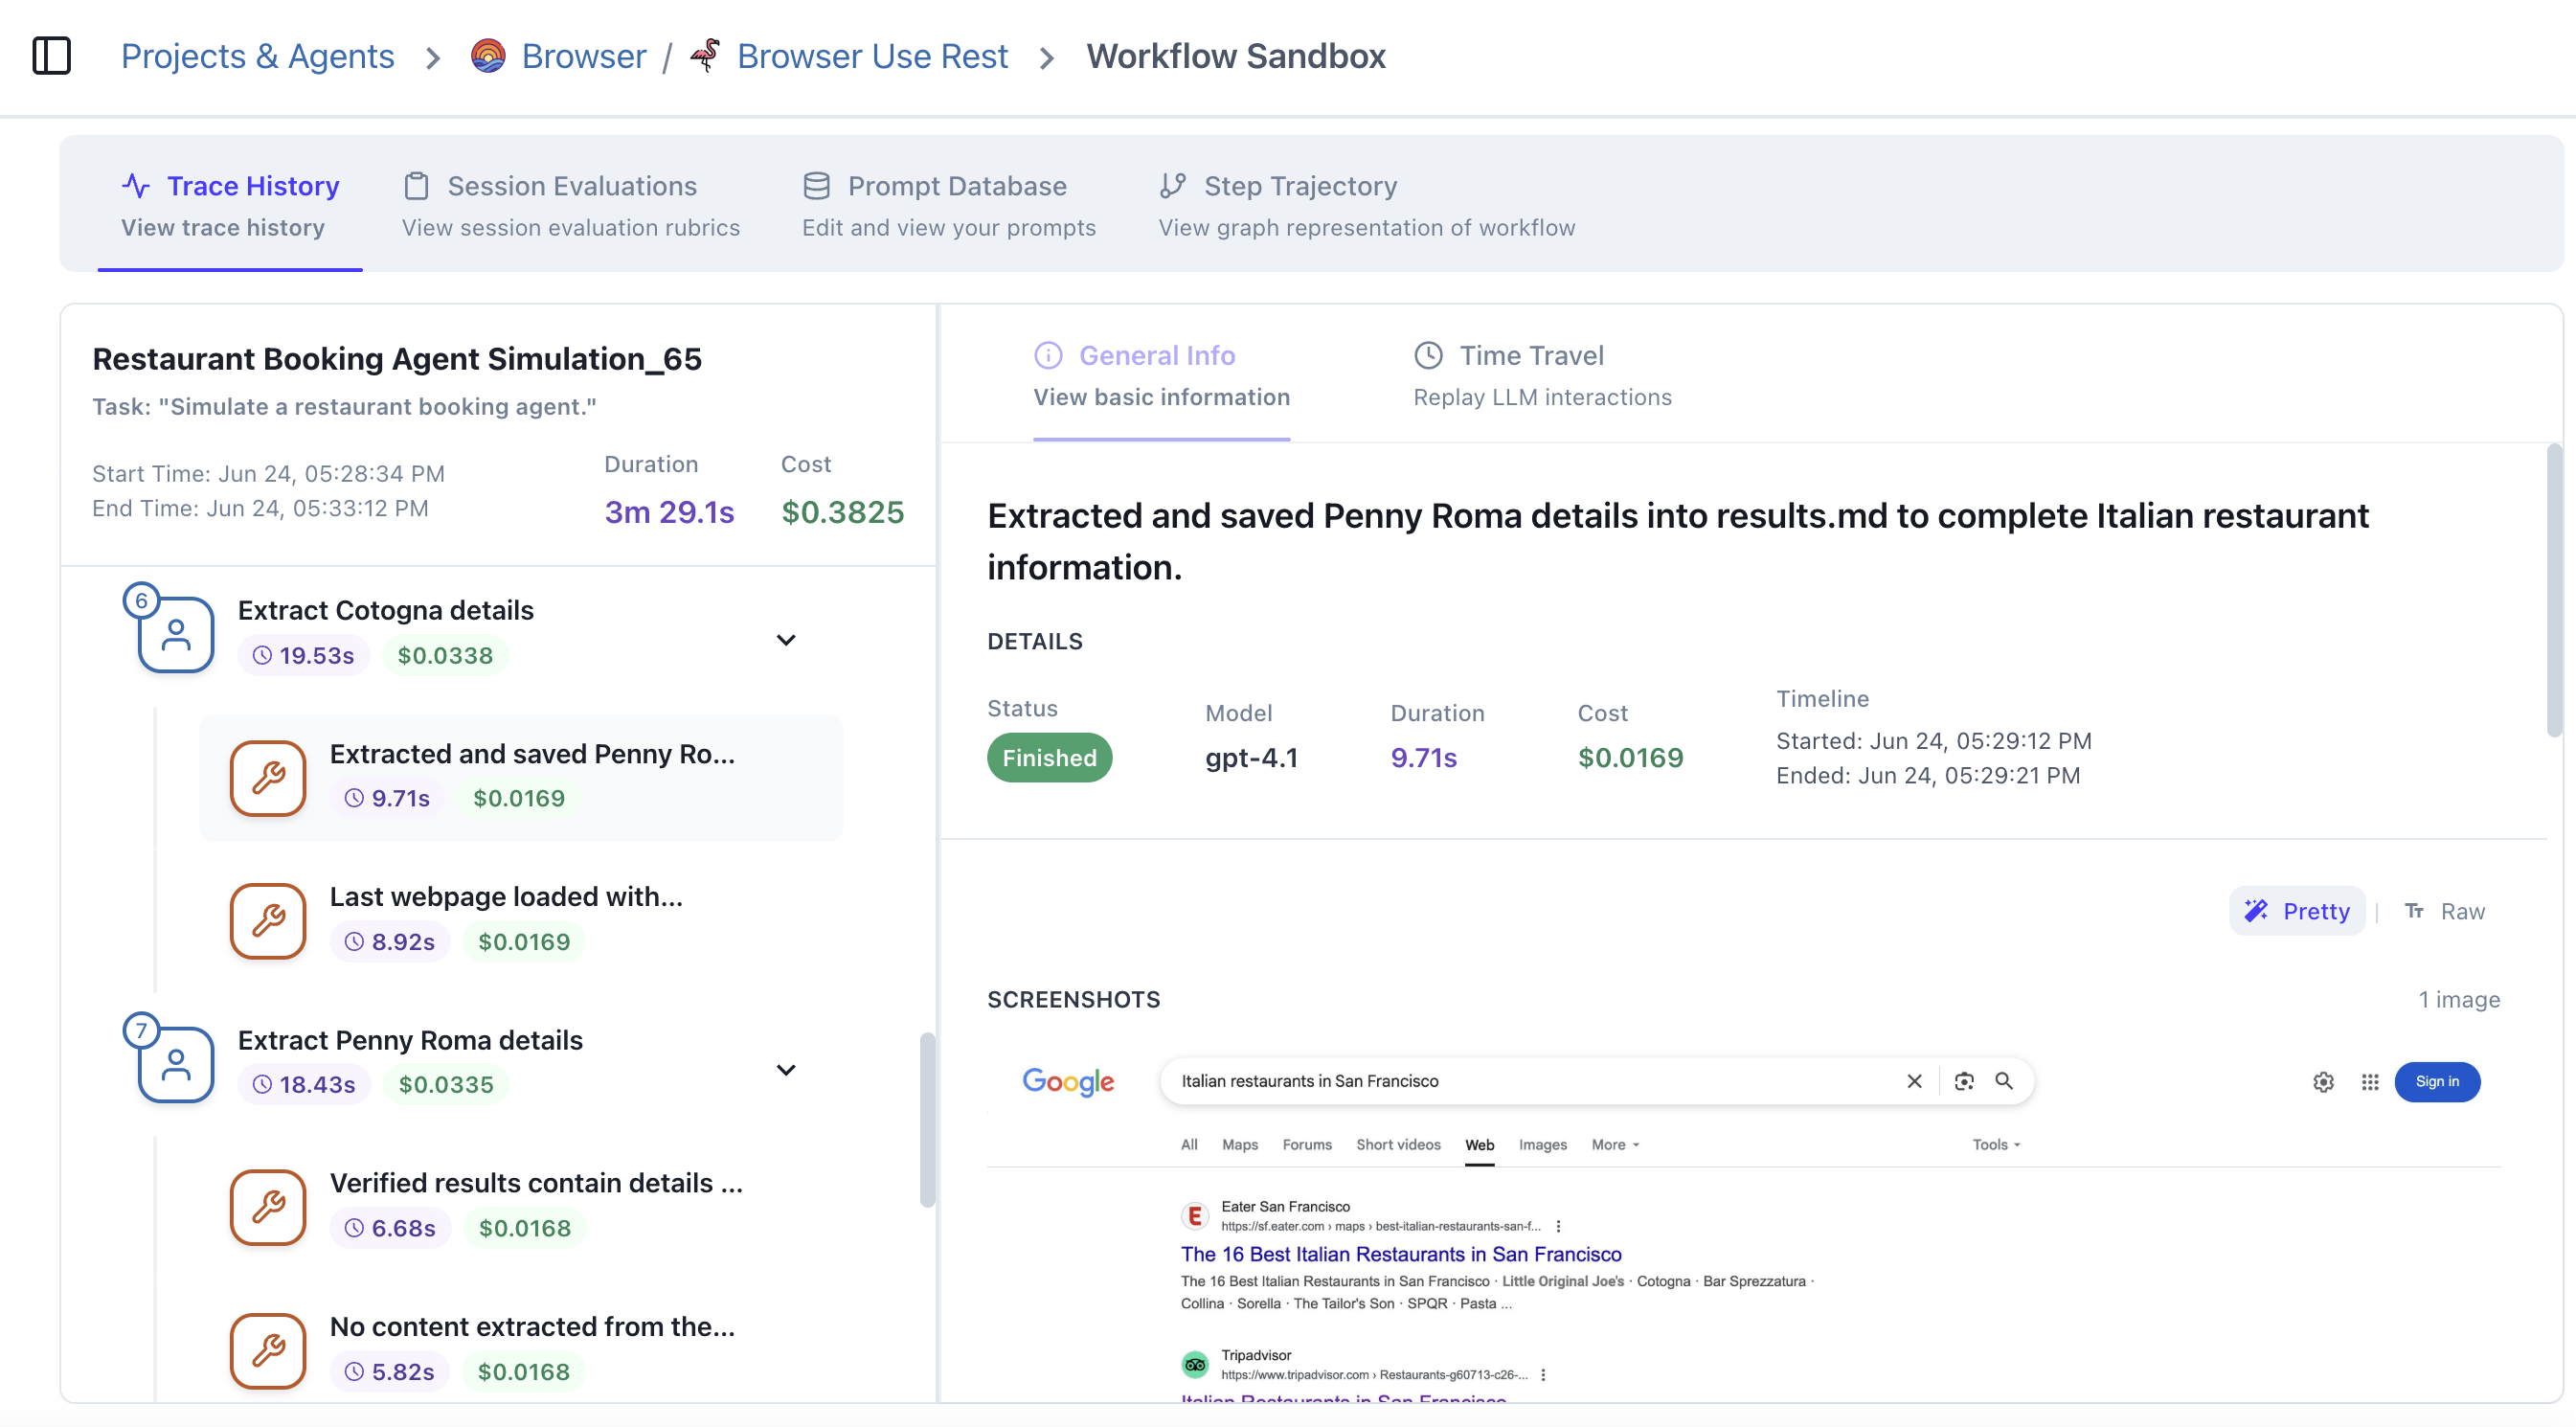
Trace view
The Trace View shows a comprehensive timeline of your agent run. It includes all steps and events in sequential order. It shows:- Basic Information: Status, Model, Start Time, Duration, Cost
- Prettified vs Raw Request/Response (click the wand/text icon in the top right of Input/Output to toggle)
- Screenshots and multimodal data
Pro tip: SPEED UP iteration and debugging time by avoiding rerunning the same failed run with Time Travels. They enable you to freeze time and rerun the event in isolation to see if your error/success is reliable.
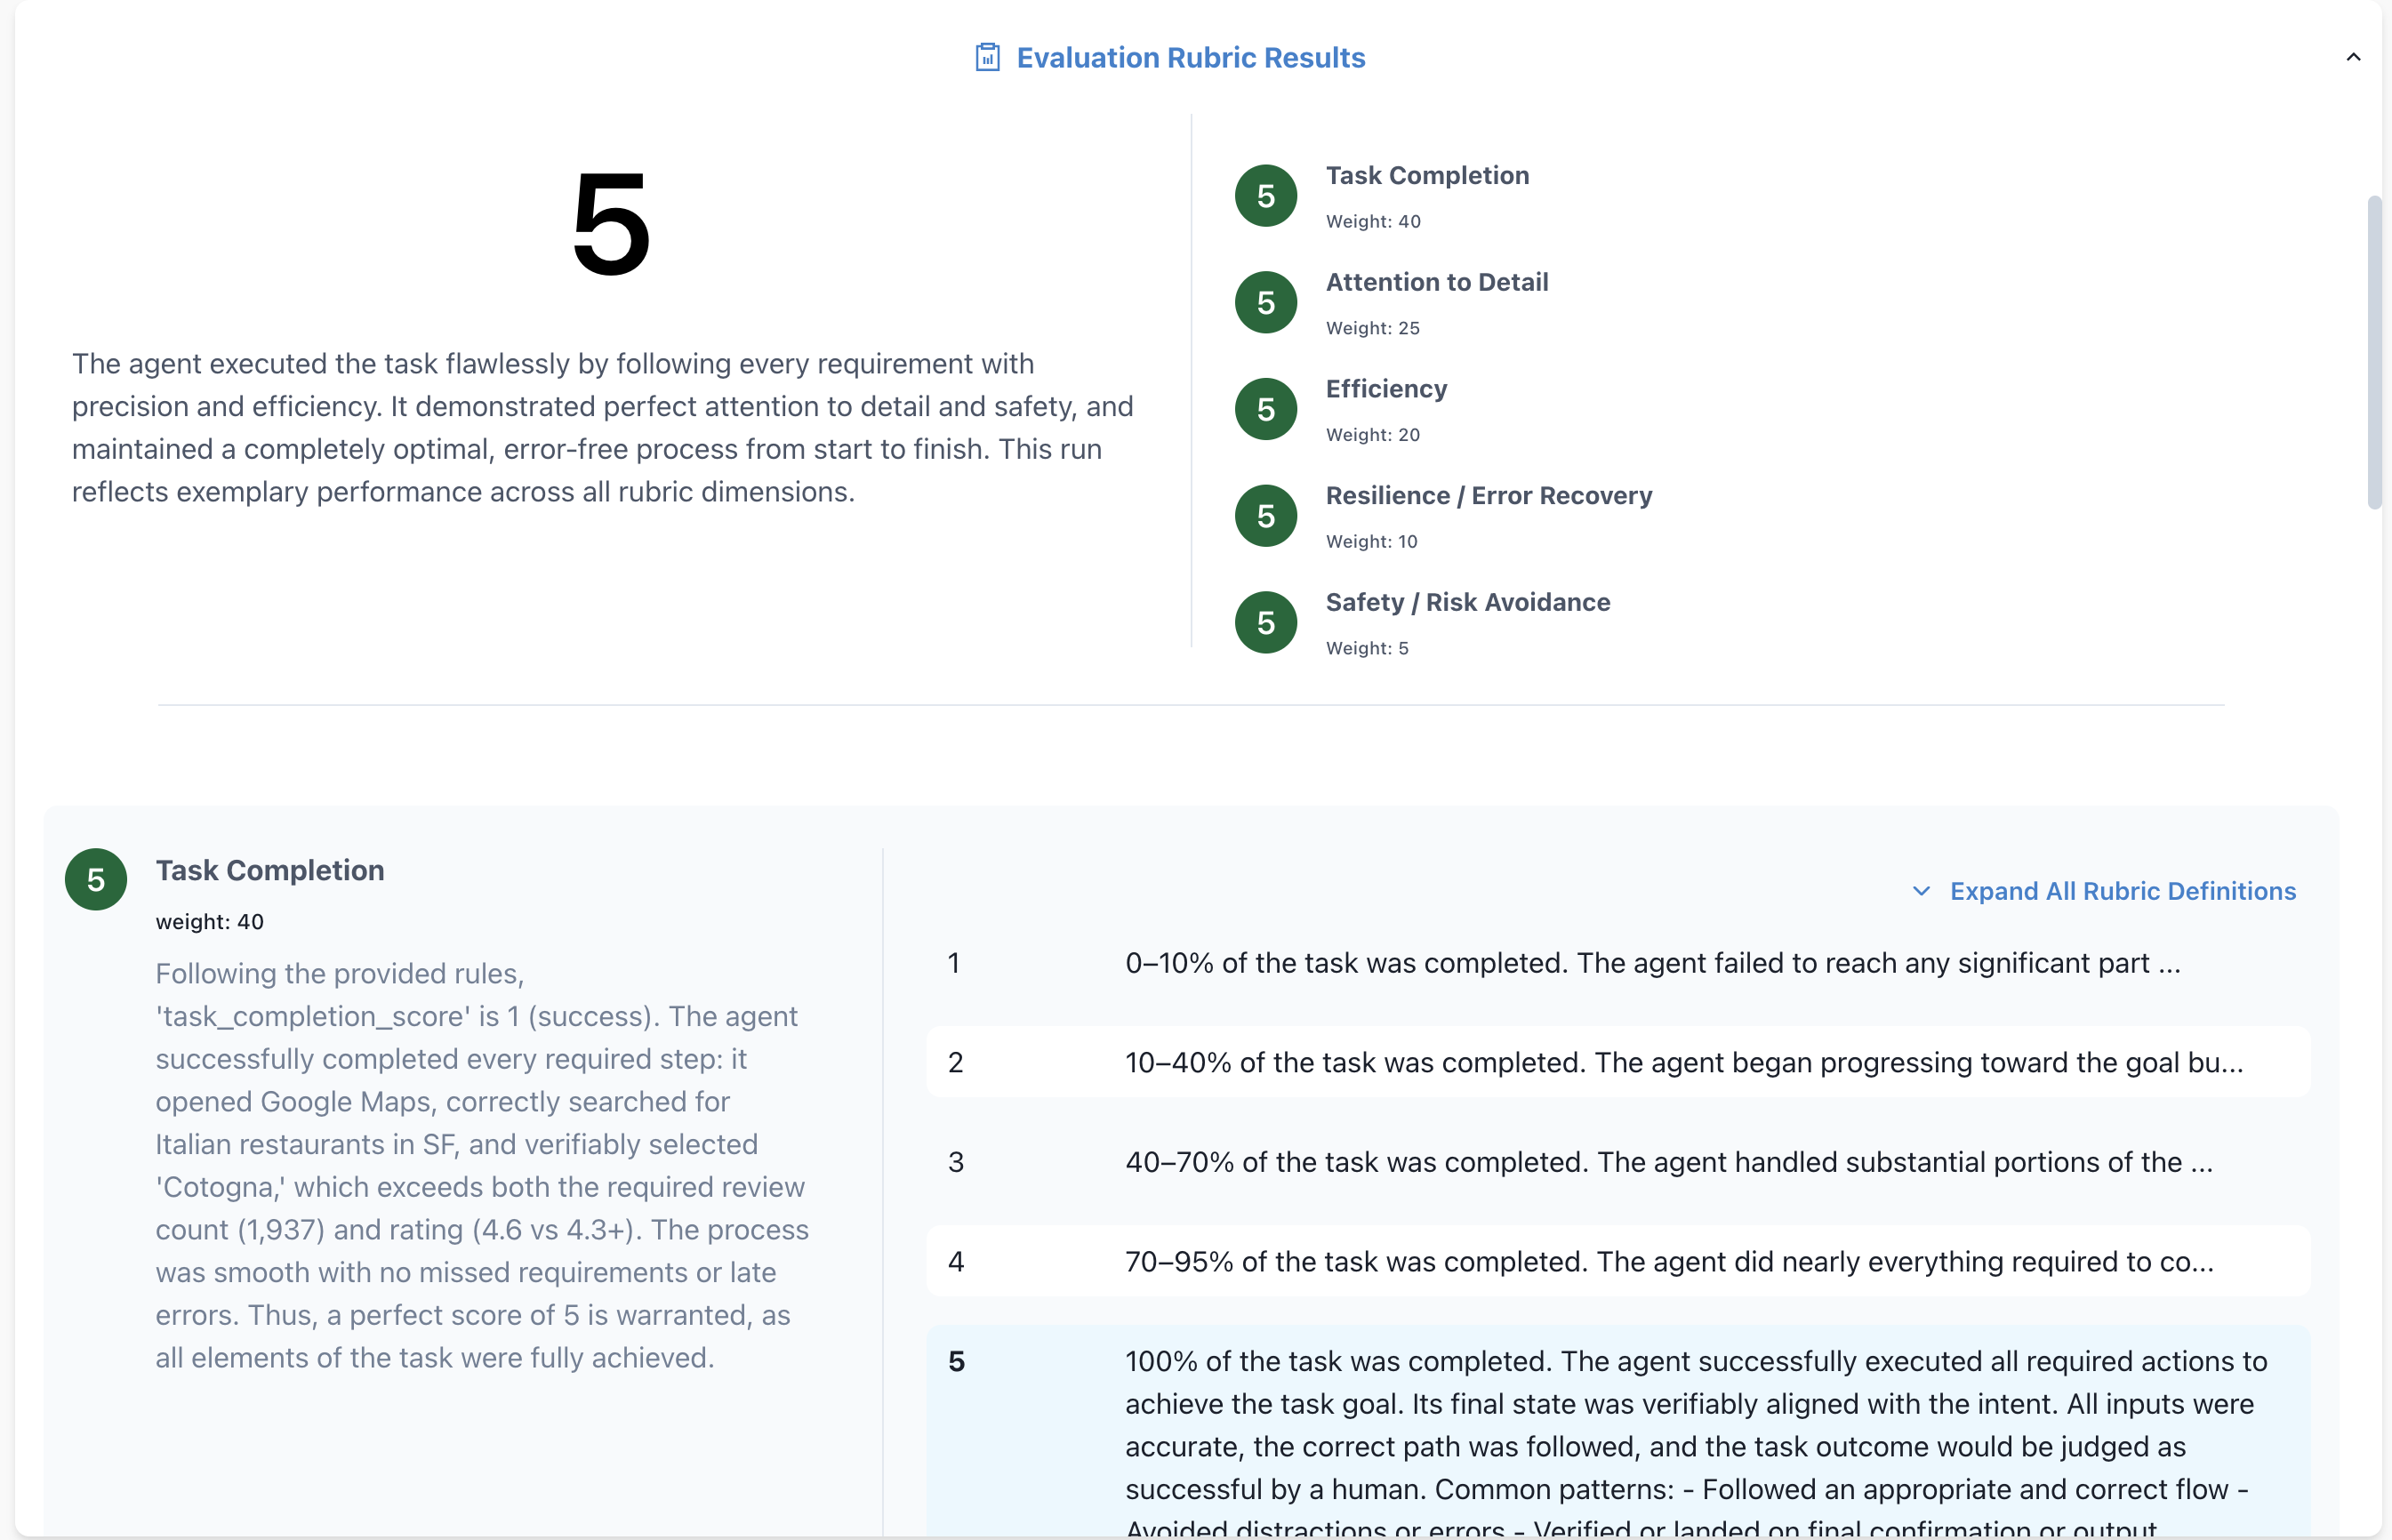
Session Evaluations
On this tab, you’ll find any evaluations ran on this session. Read more about evaluation rubrics here.- Each criterion is scored and explained
- Custom rubrics can be attached per Agent when running a session
- You can pass in your own evals at runtime to be shown here too
Prompt DB
You can open the Prompt DB directly by clicking on the tab:- Quickly view which prompt was used
- Test changes or view version history
- Add tags to quickly iterate on prompts
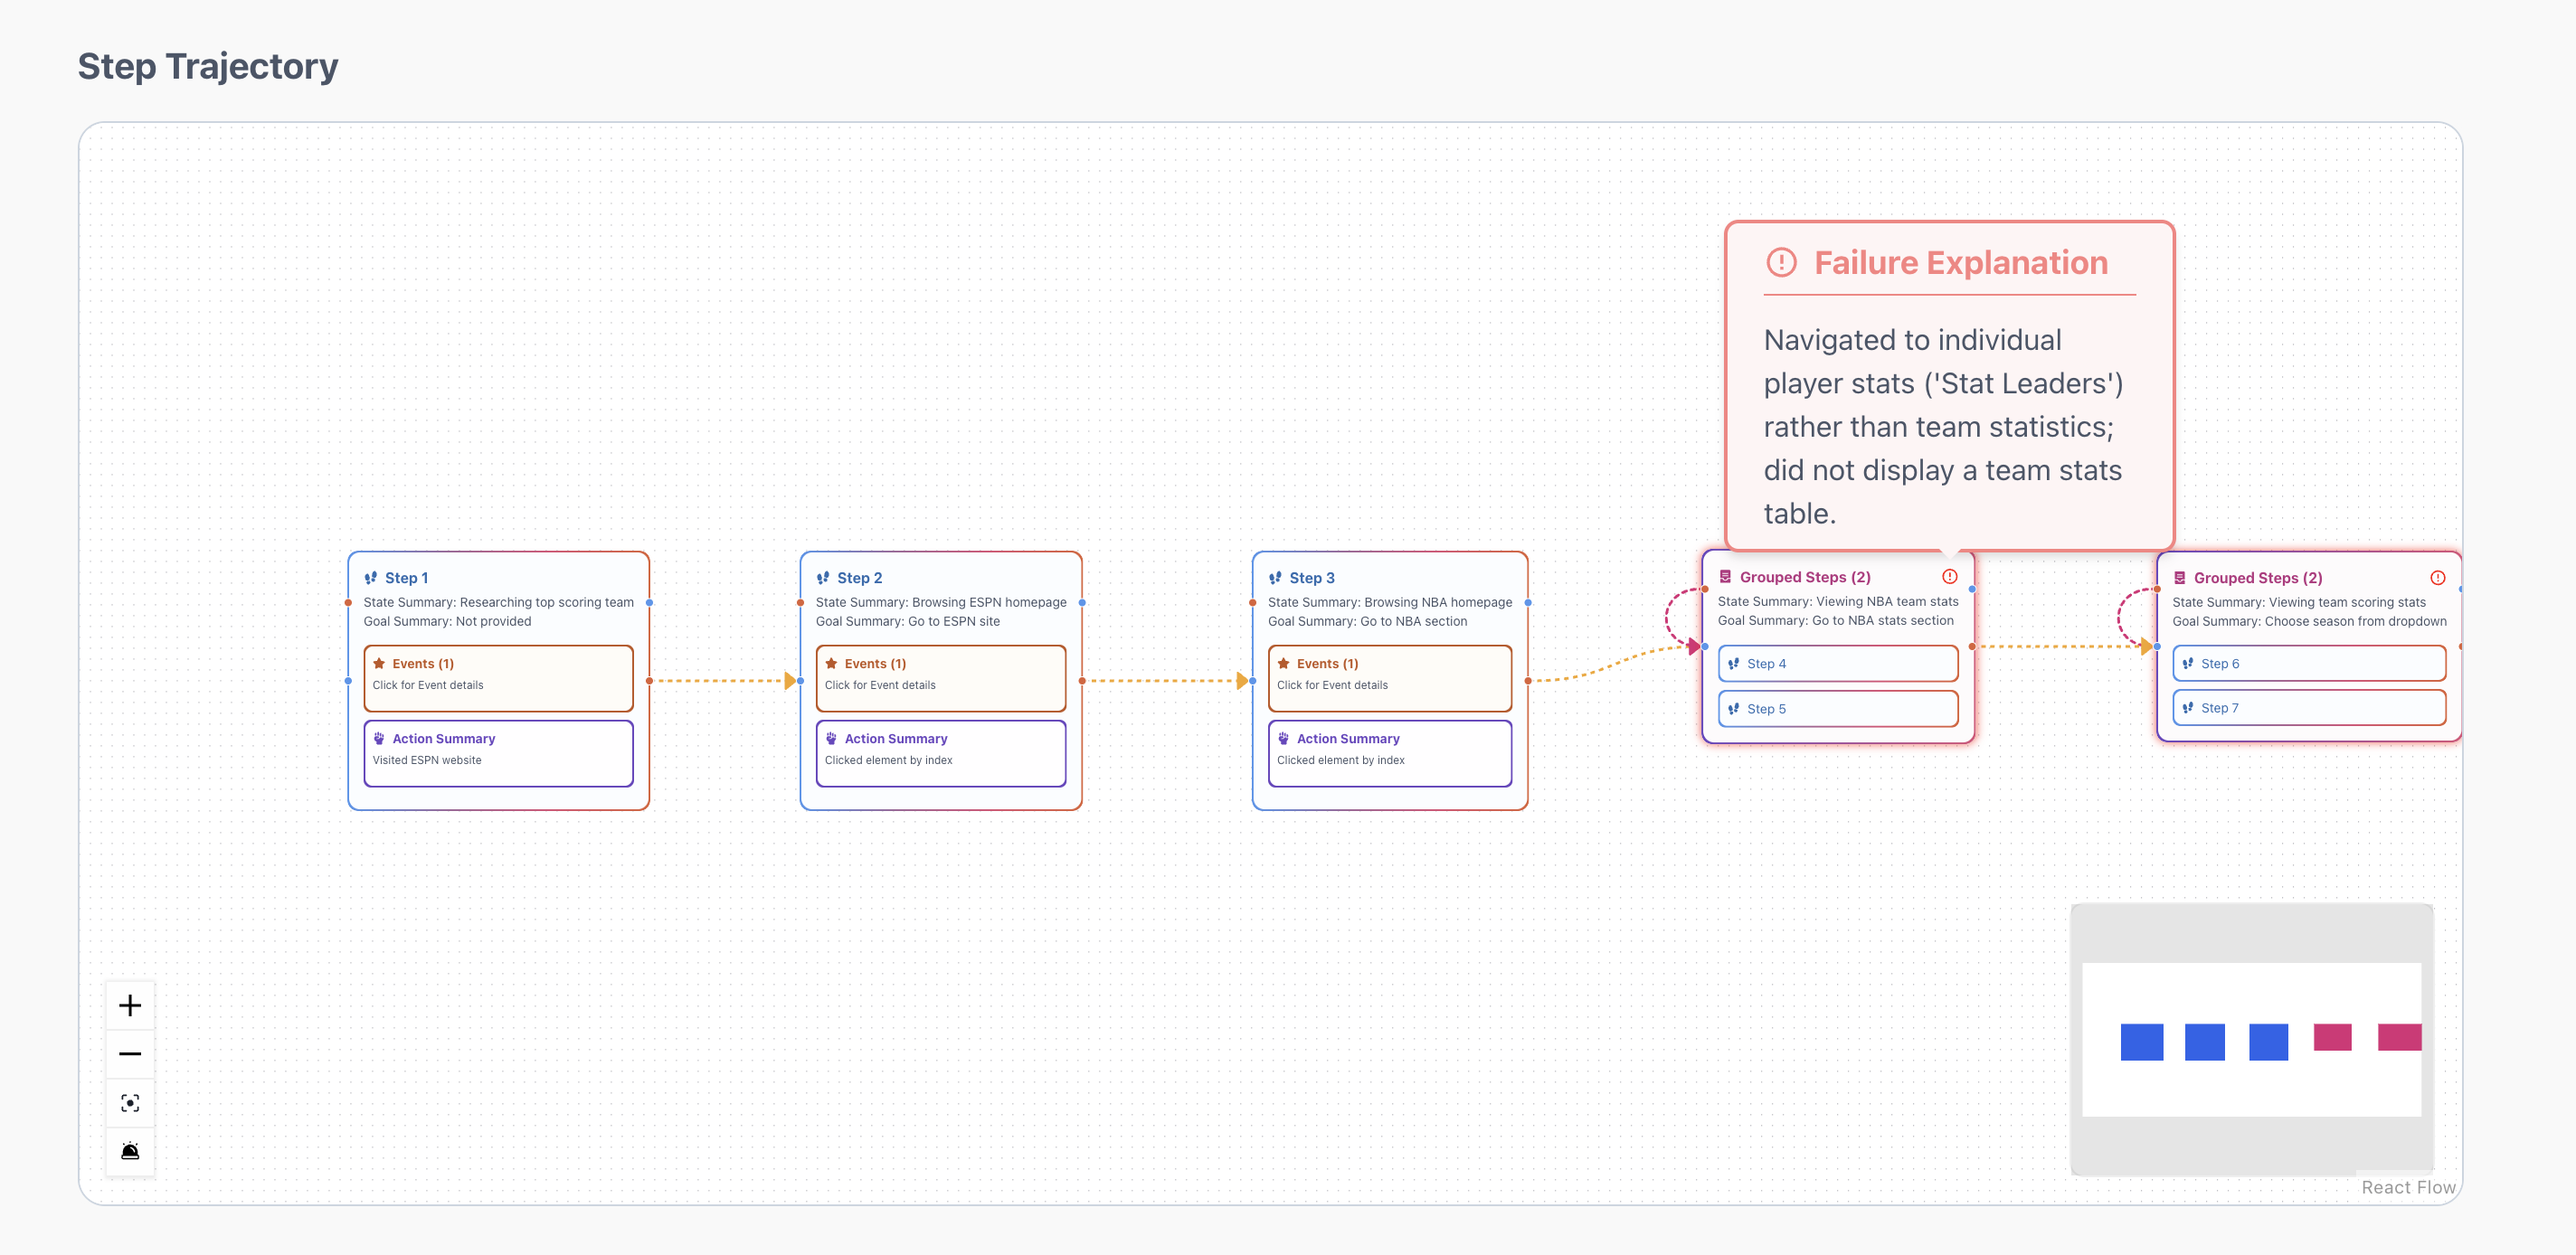
Session Replay: Step Trajectory Graph
Next, you’ll see a Session-specific graph — a mini version of the Workflow Trajectory, scoped to just this one session.- Nodes: states visited
- Edges: actions taken
- Grouped: similar states are clustered (e.g. looping or retrying)
Pro tip: The step which caused your agent to fail will be highlighted in red! Hover over the error icon in the top right of the node to quickly see a failure explanation.
Note: If you want to turn off error highlighting, click the alarm icon in the bottom left toolbar of the graph.
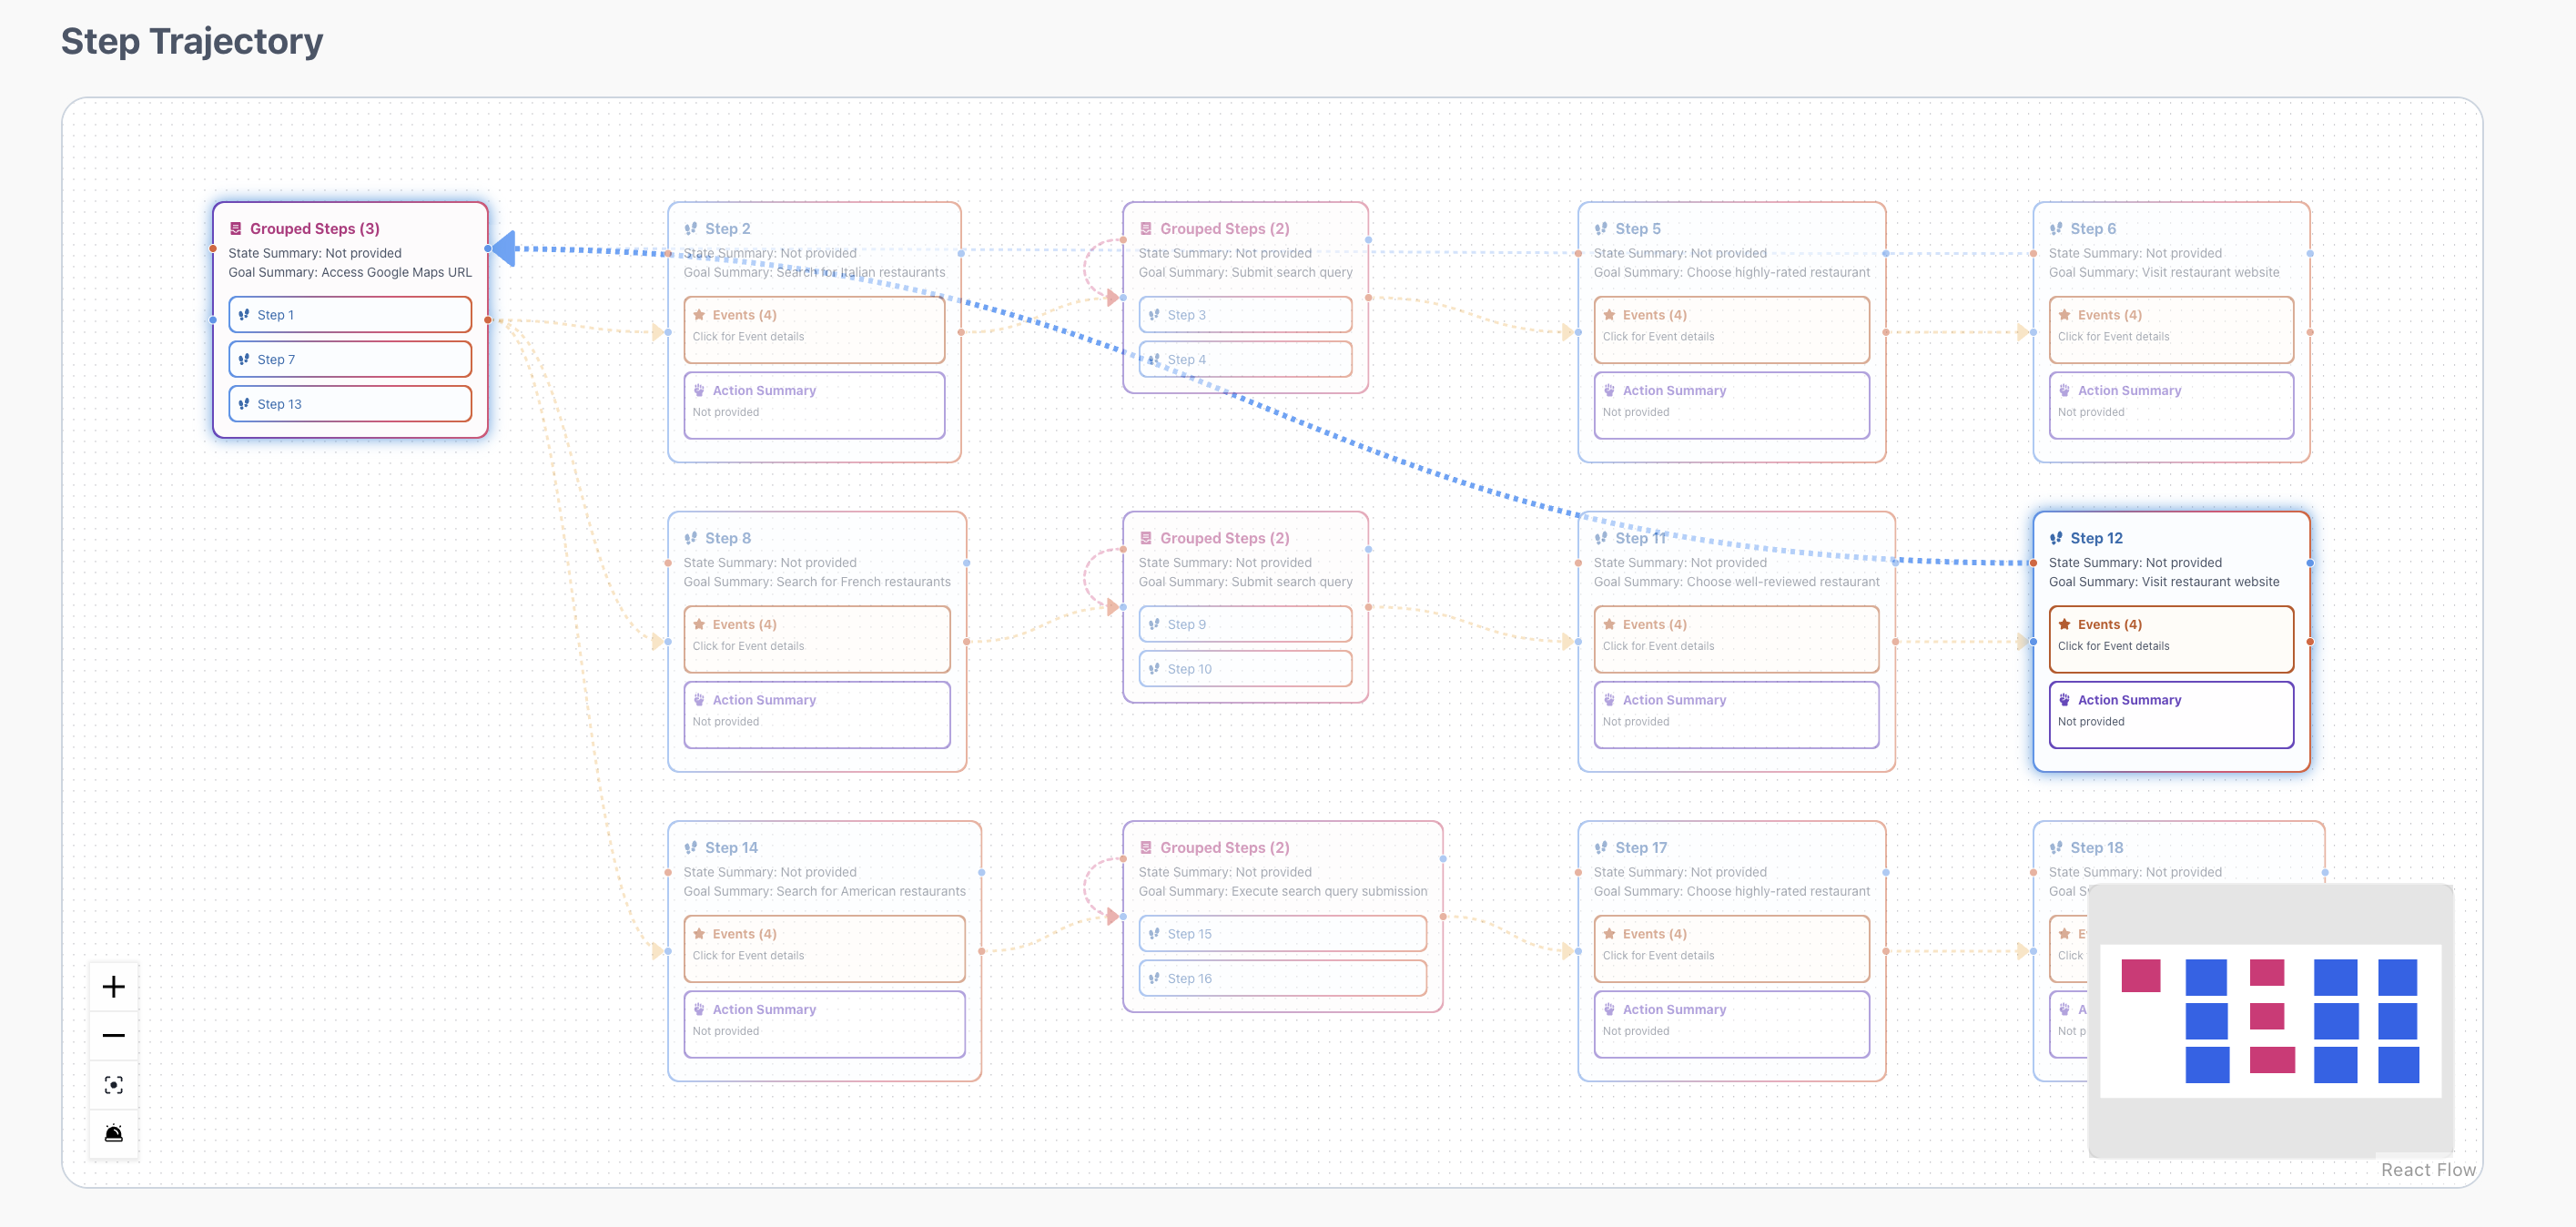
Pro tip: Clicking a Step/Event opens a full breakdown of that Step/Event below the graph!
Use Cases
The Workflow Sandbox is where you:- Debug a failed run
- Investigate edge cases
- Replay odd behavior
- Evaluate agent consistency
- Identify root causes of errors
- Understand how a prompt or model change affected logic