Workflow Trajectory
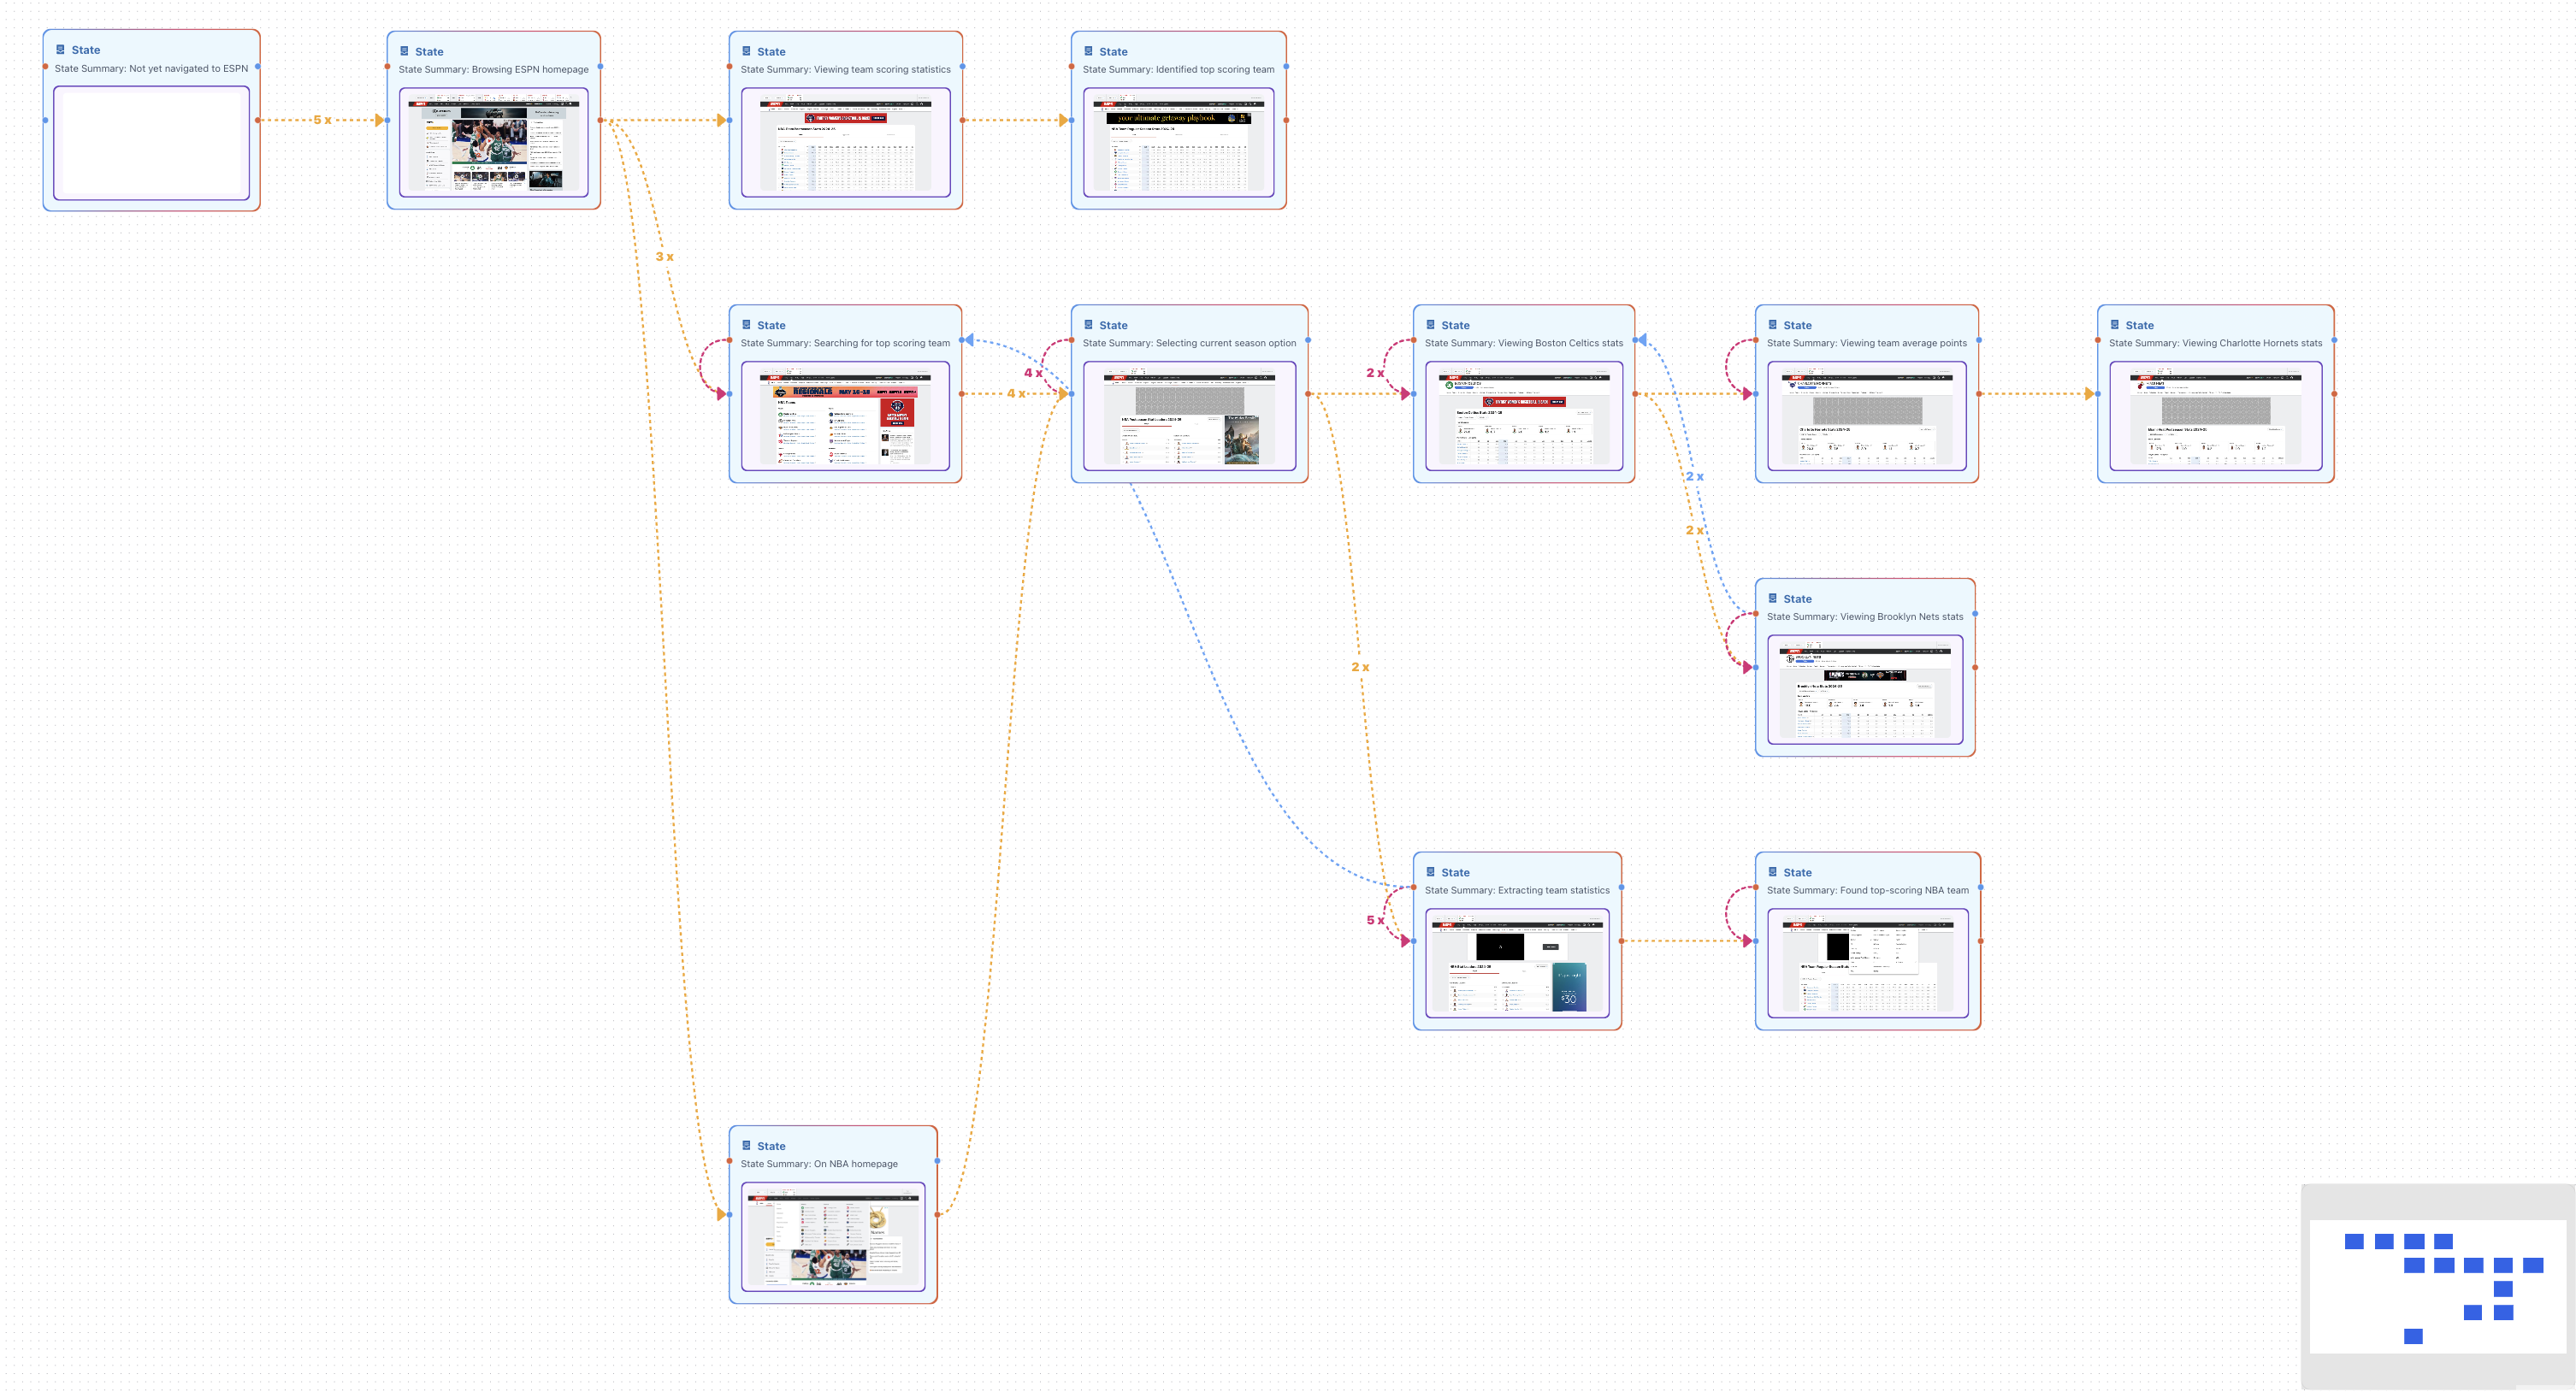
The Workflow Trajectory graph is a core visualization in every Mass Simulation. It merges all agent behavior across multiple Sessions into a single, clustered graph — giving you a bird’s-eye view of the decision space your agent explores. It reveals not just what happened, but what could happen — and how often.What It Shows
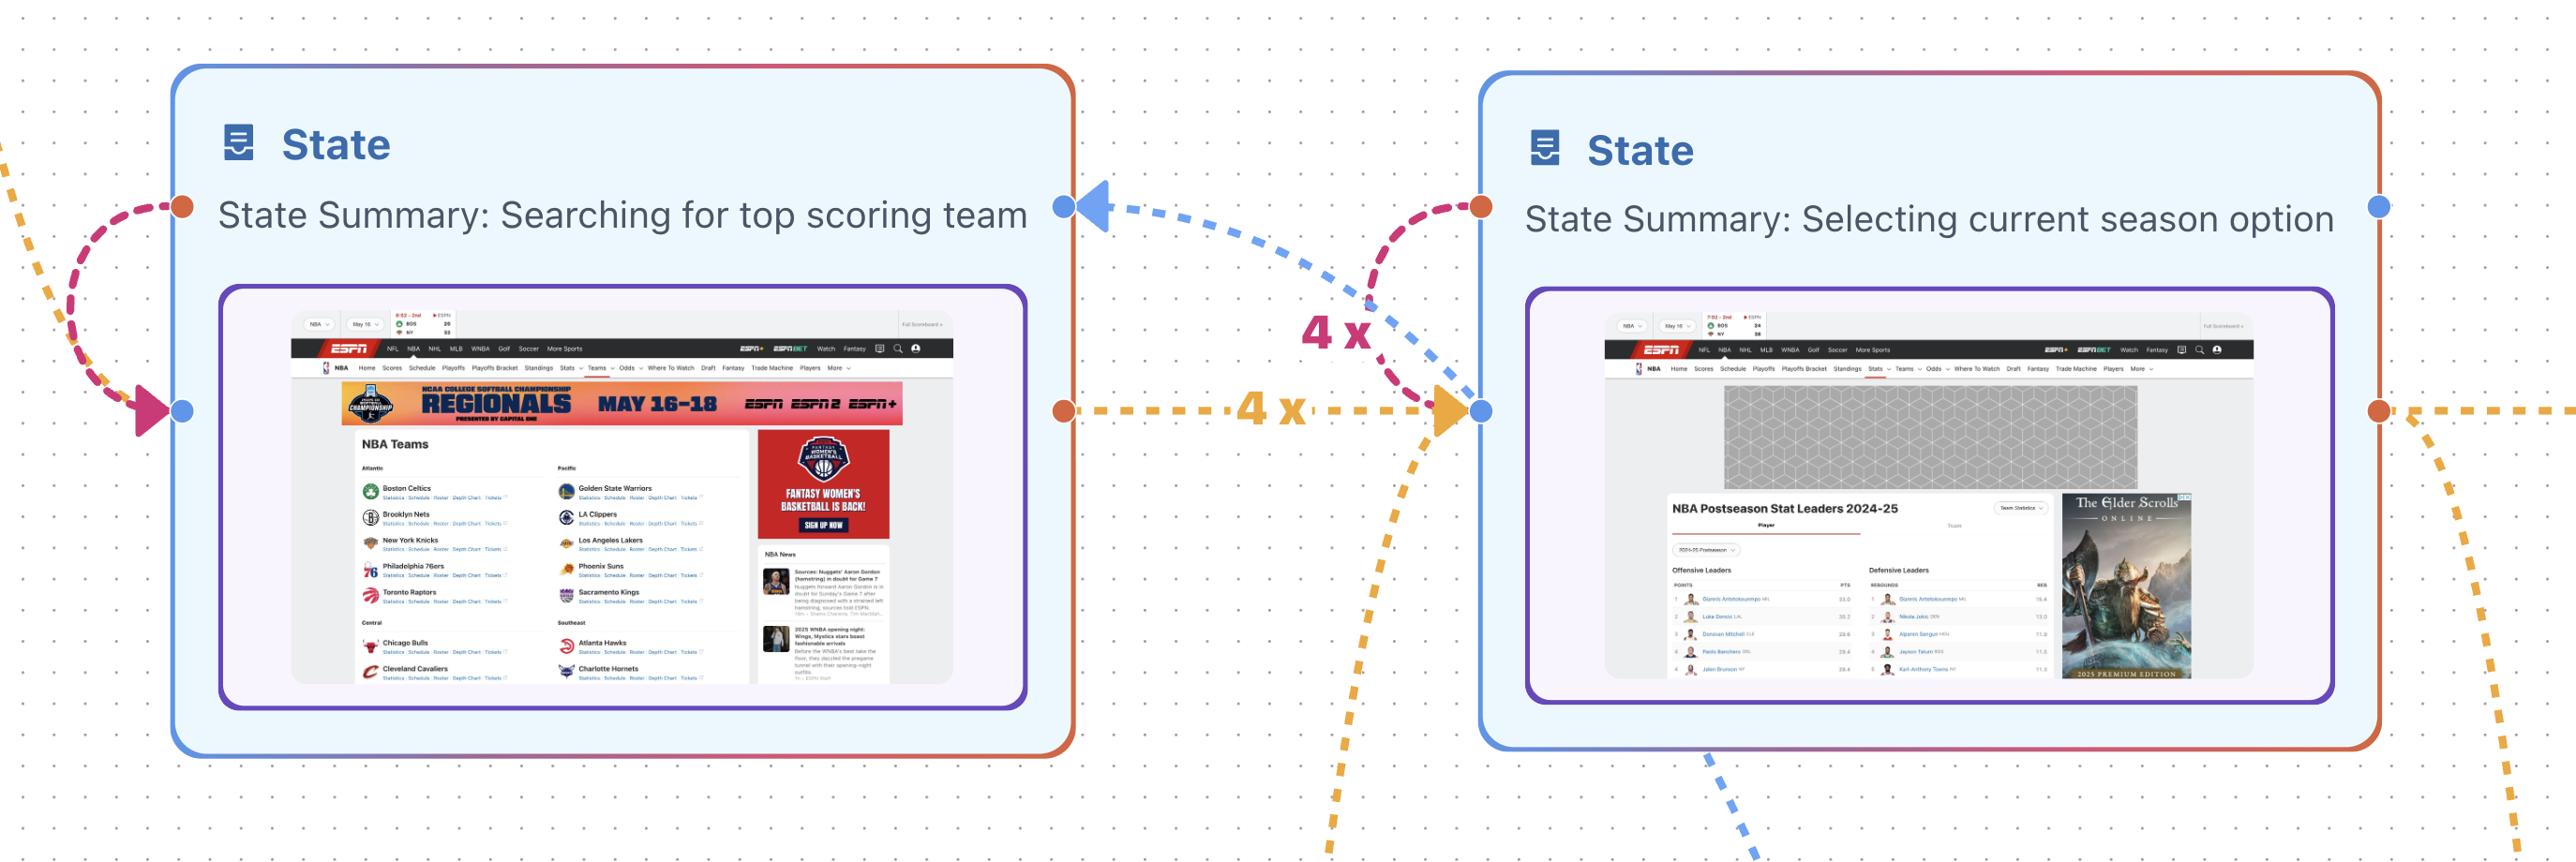
Each node in the Workflow Trajectory represents a grouped state the agent reached (e.g., same web page, same state string, or same screenshot). Each edge represents a transition (an action) the agent took between states.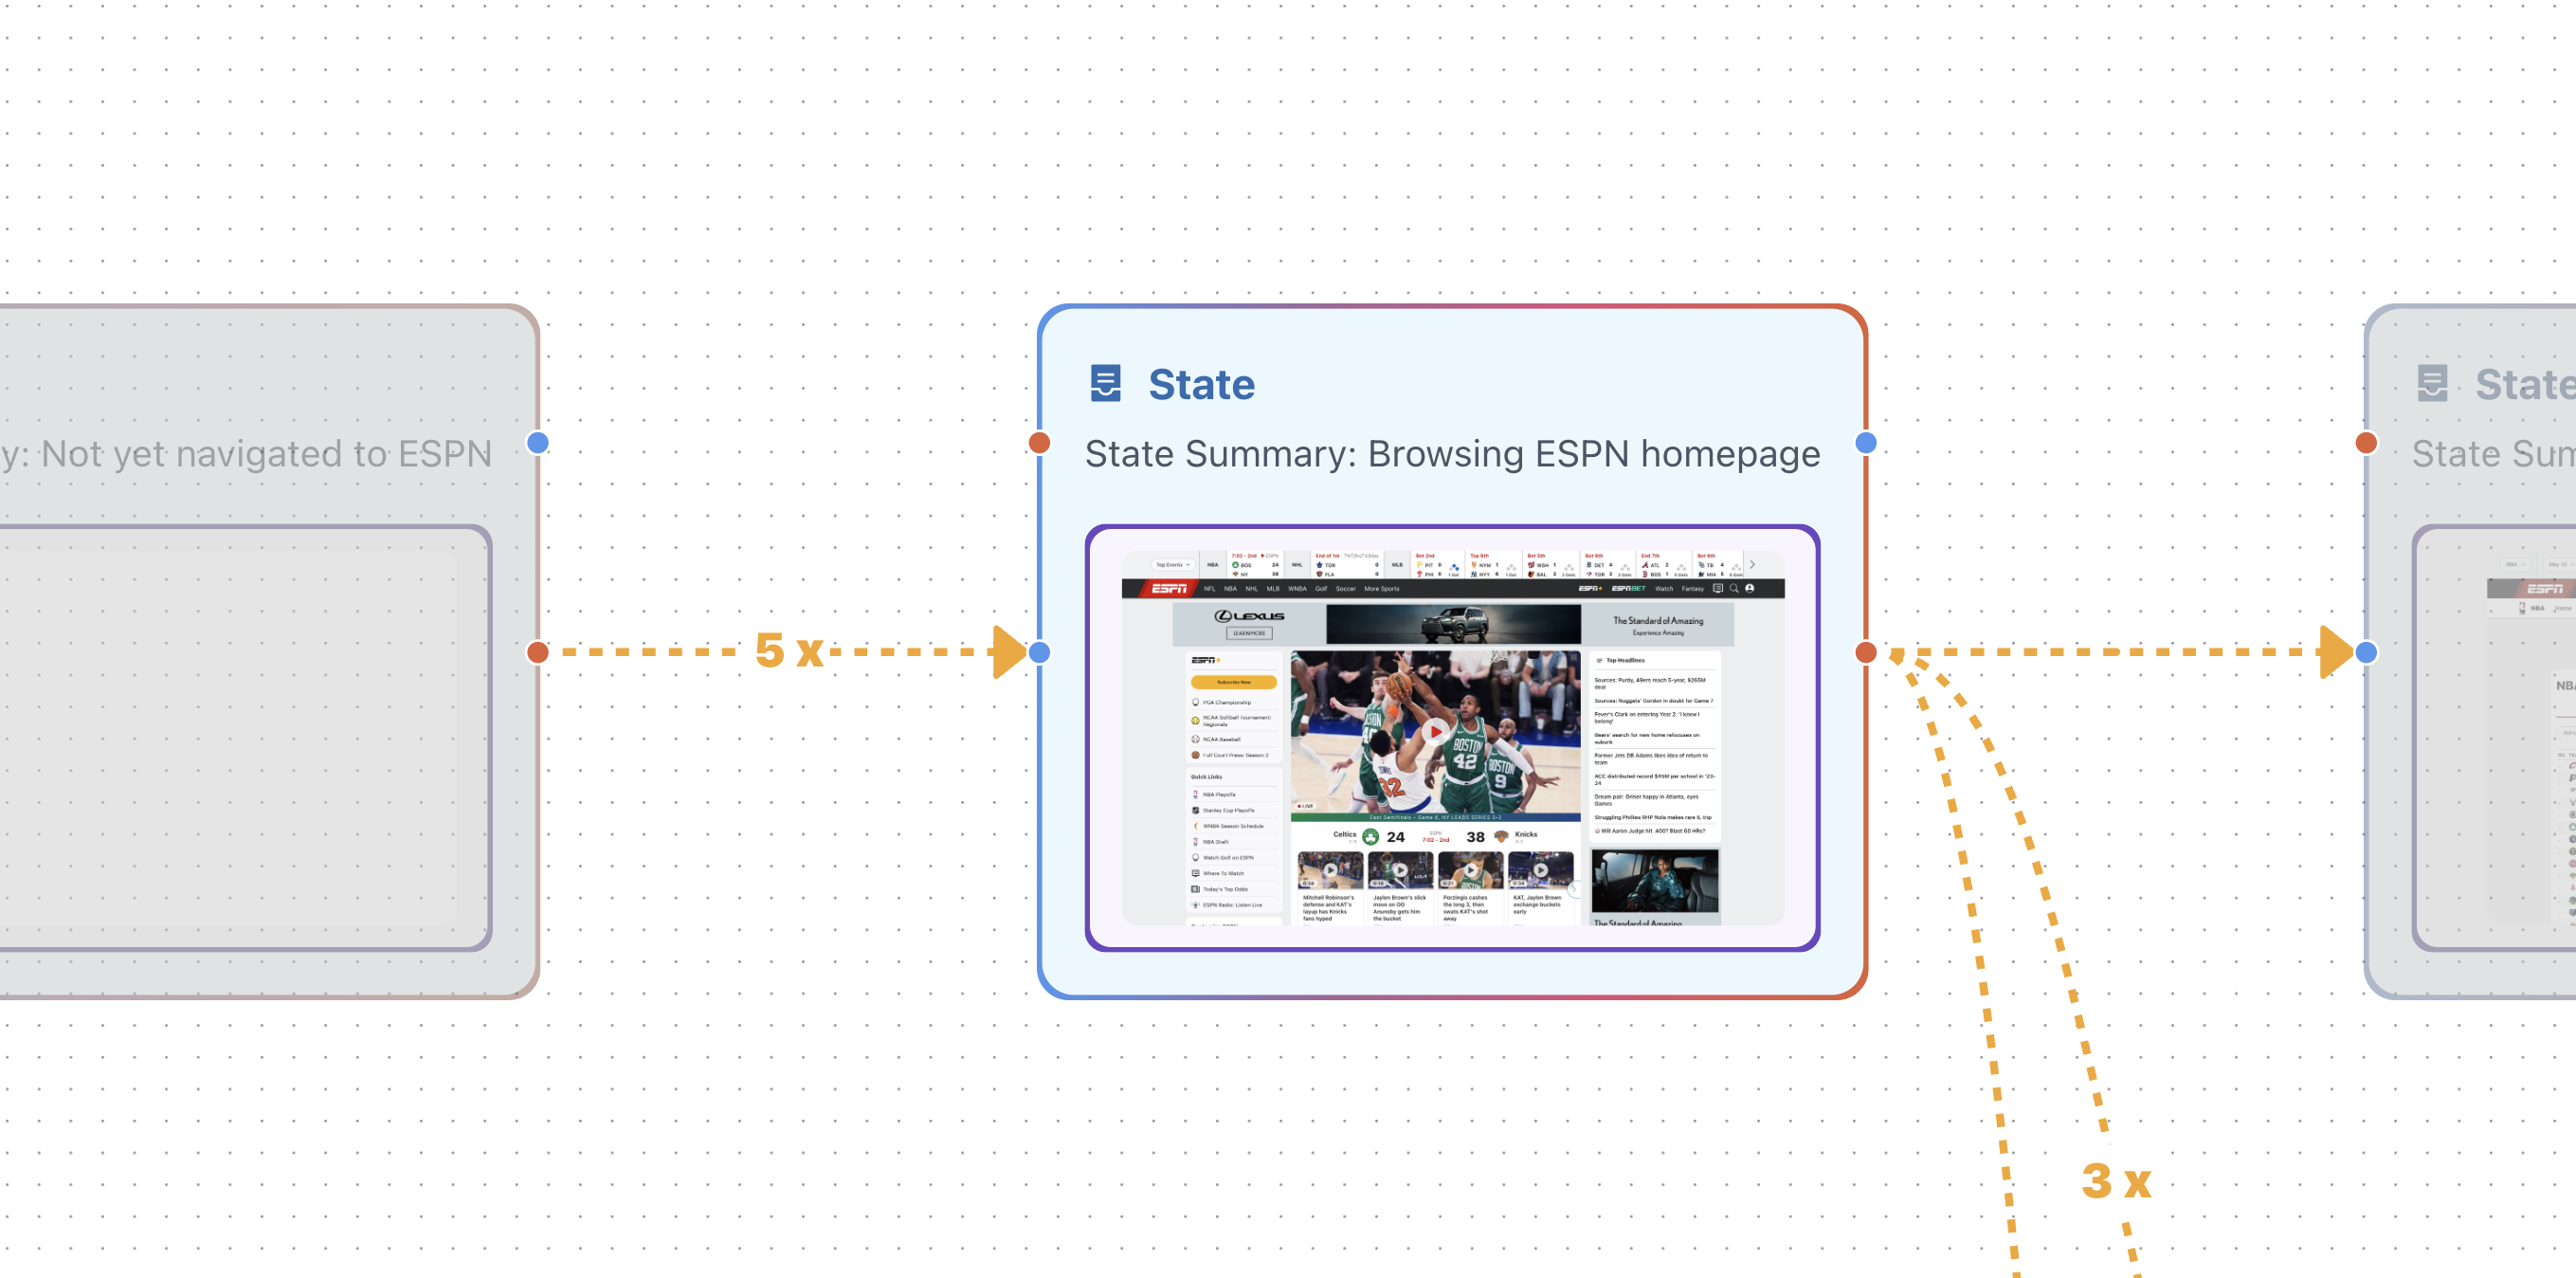
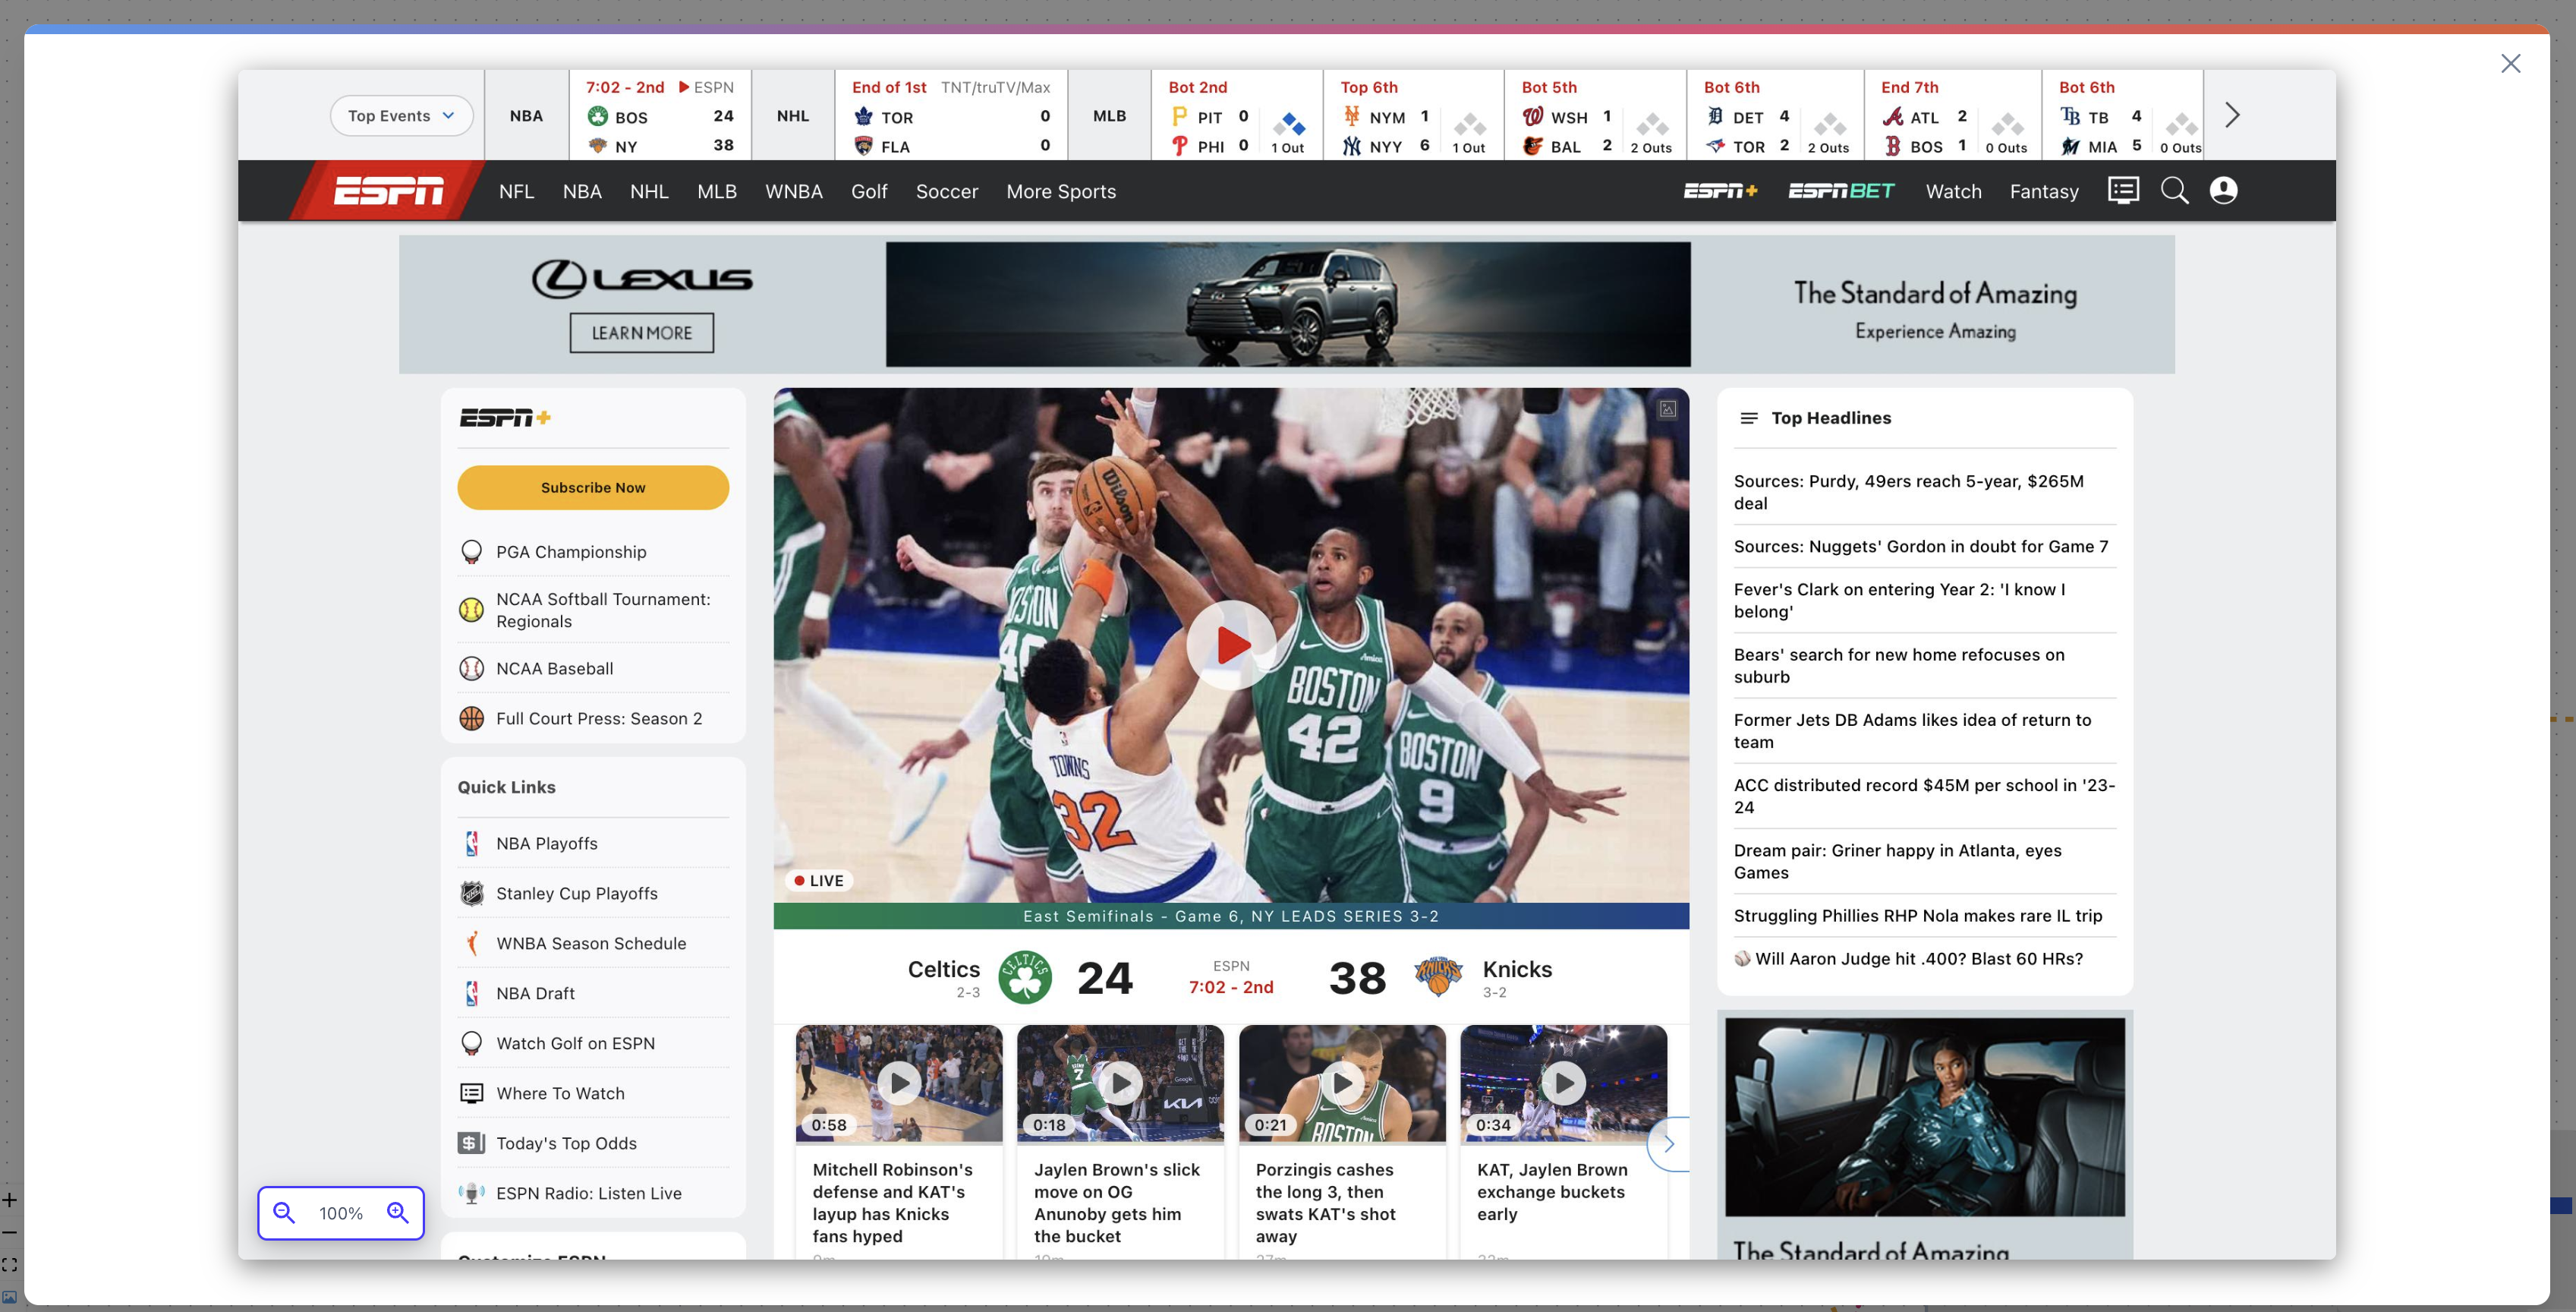
- Click the image in the node to see it in more detail
Interacting with the Graph
- Orange edges are forward transitions — the agent moved forward to a new state
- Blue edges are backward transitions — the agent moved back to a previous state
- Pink edges are self transitions — the agent went back to the same state
- The multiplier shows the frequency of that transition across all sessions (i.e. how many sessions took that transition)
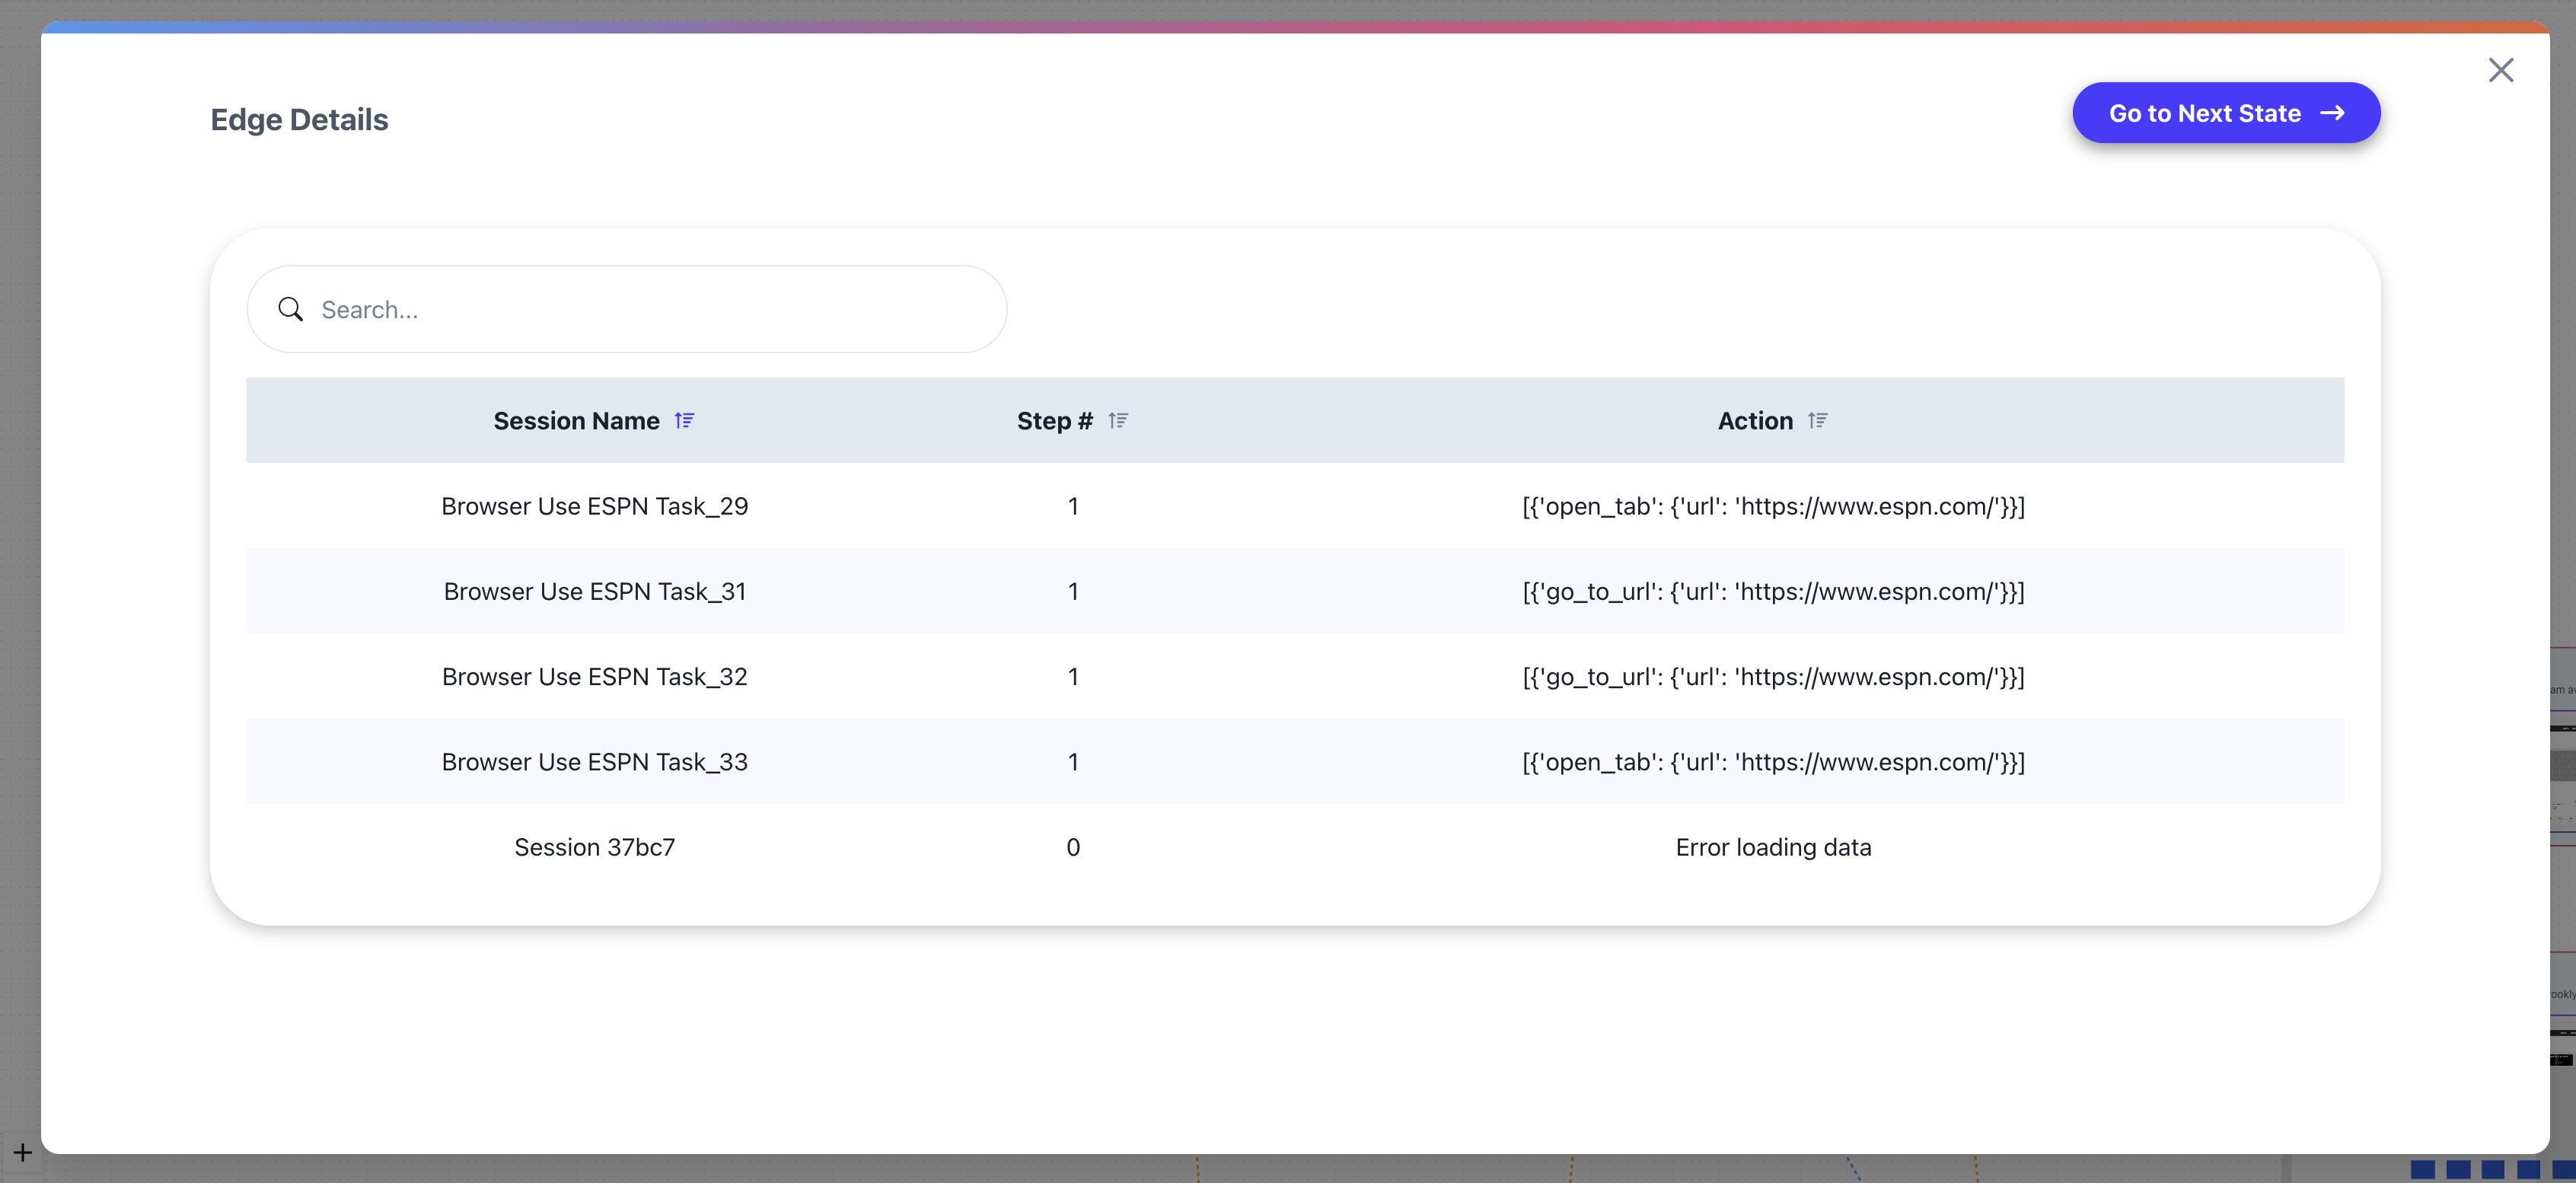
- Click into a node to inspect all sessions that passed through that state
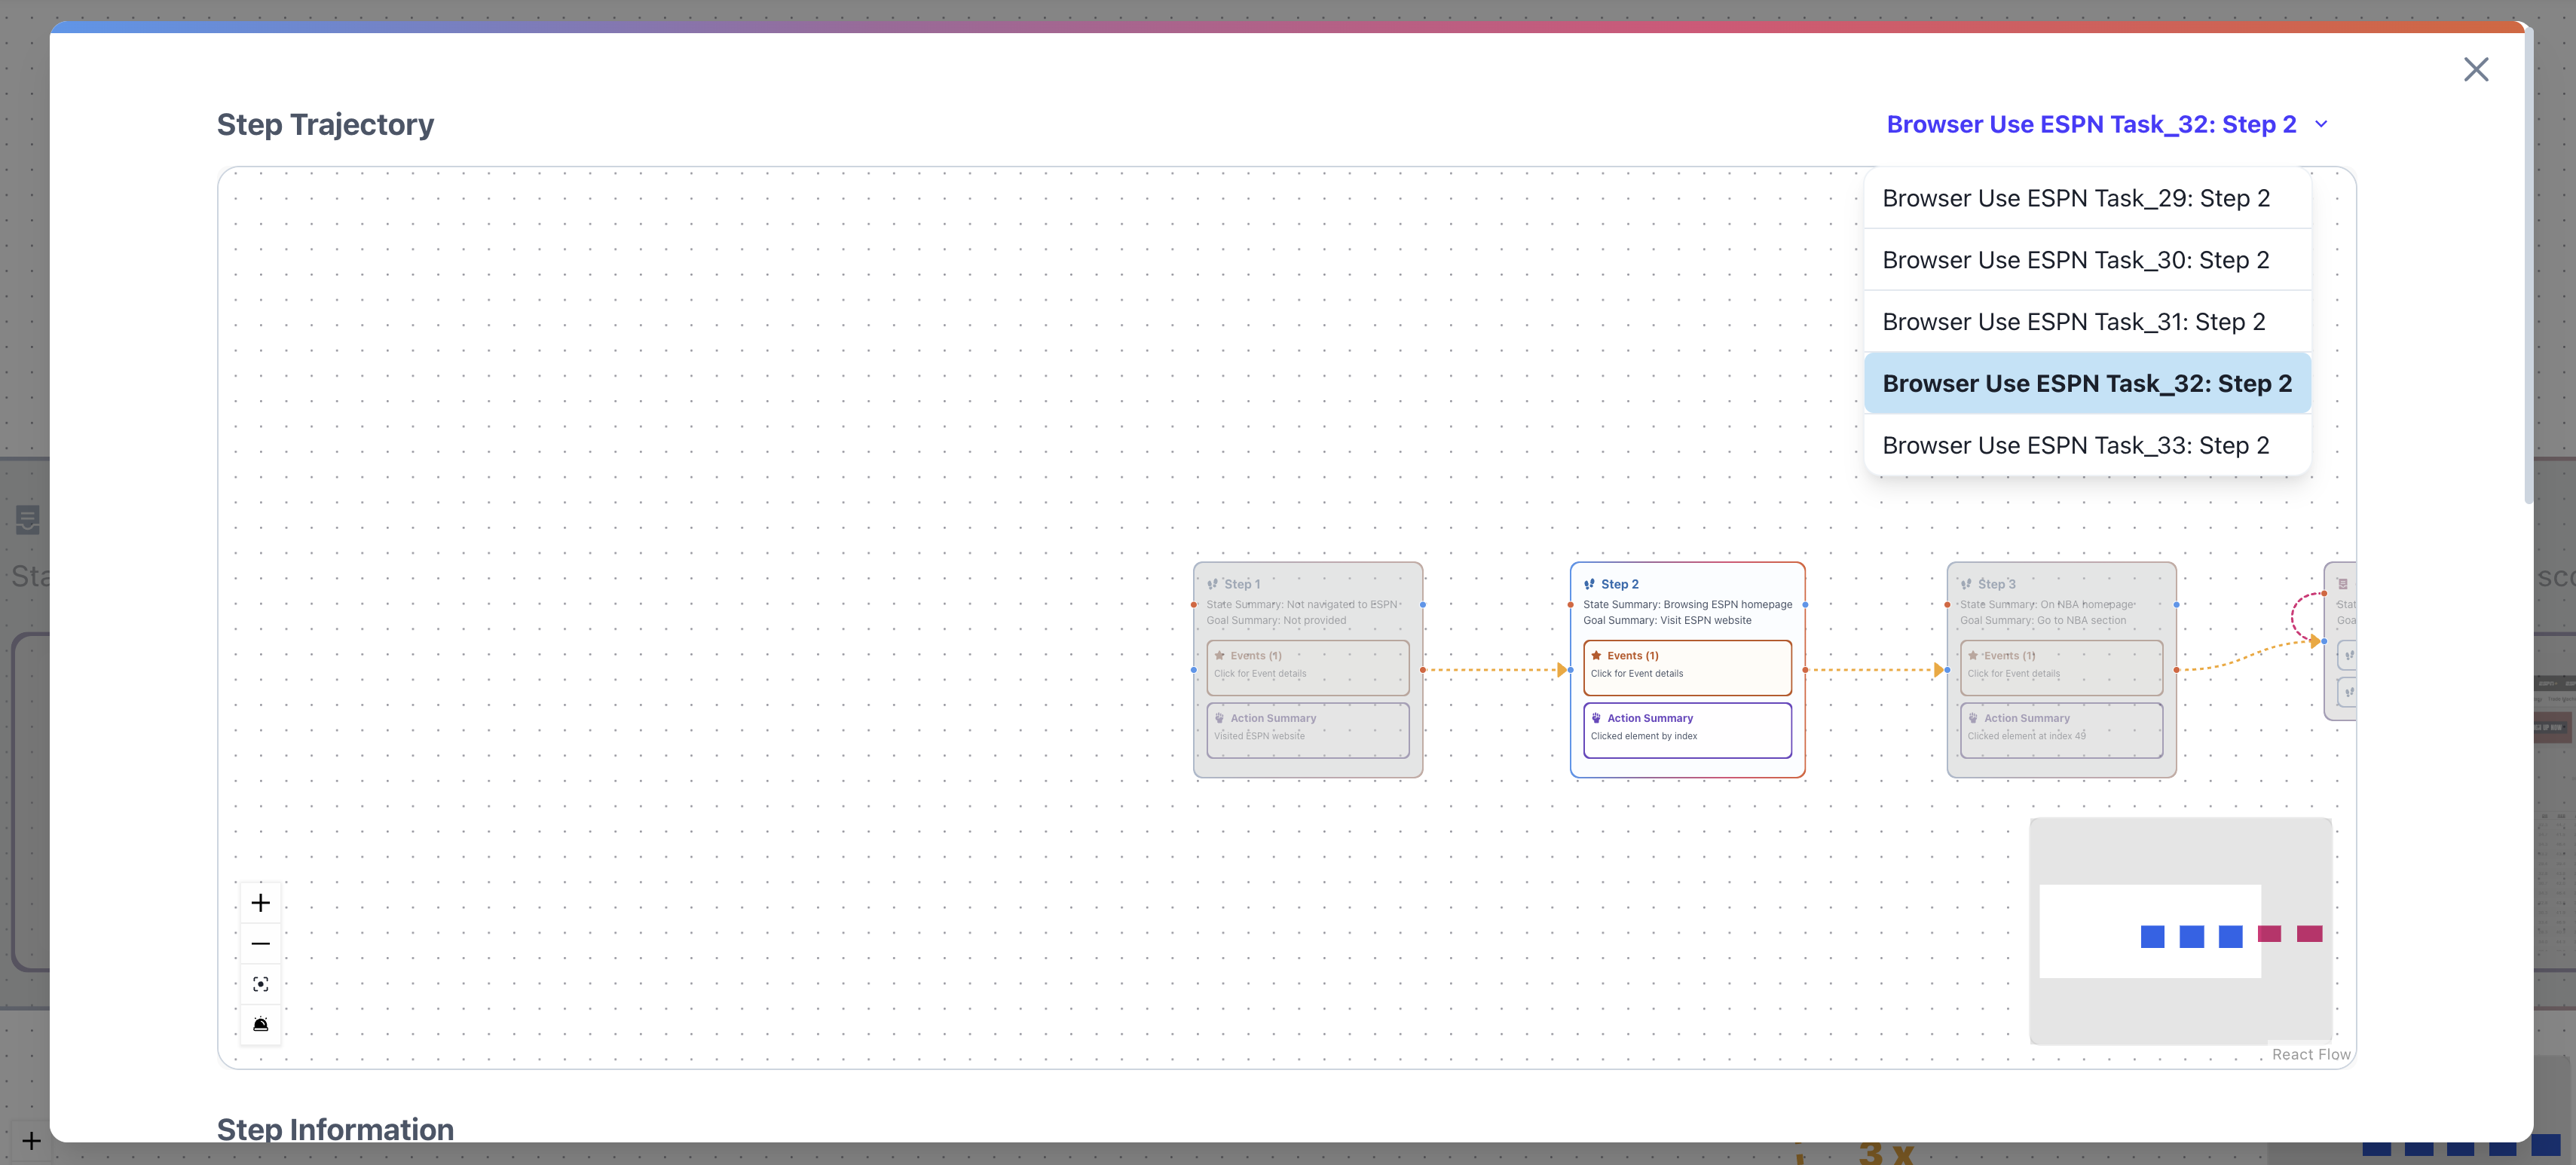
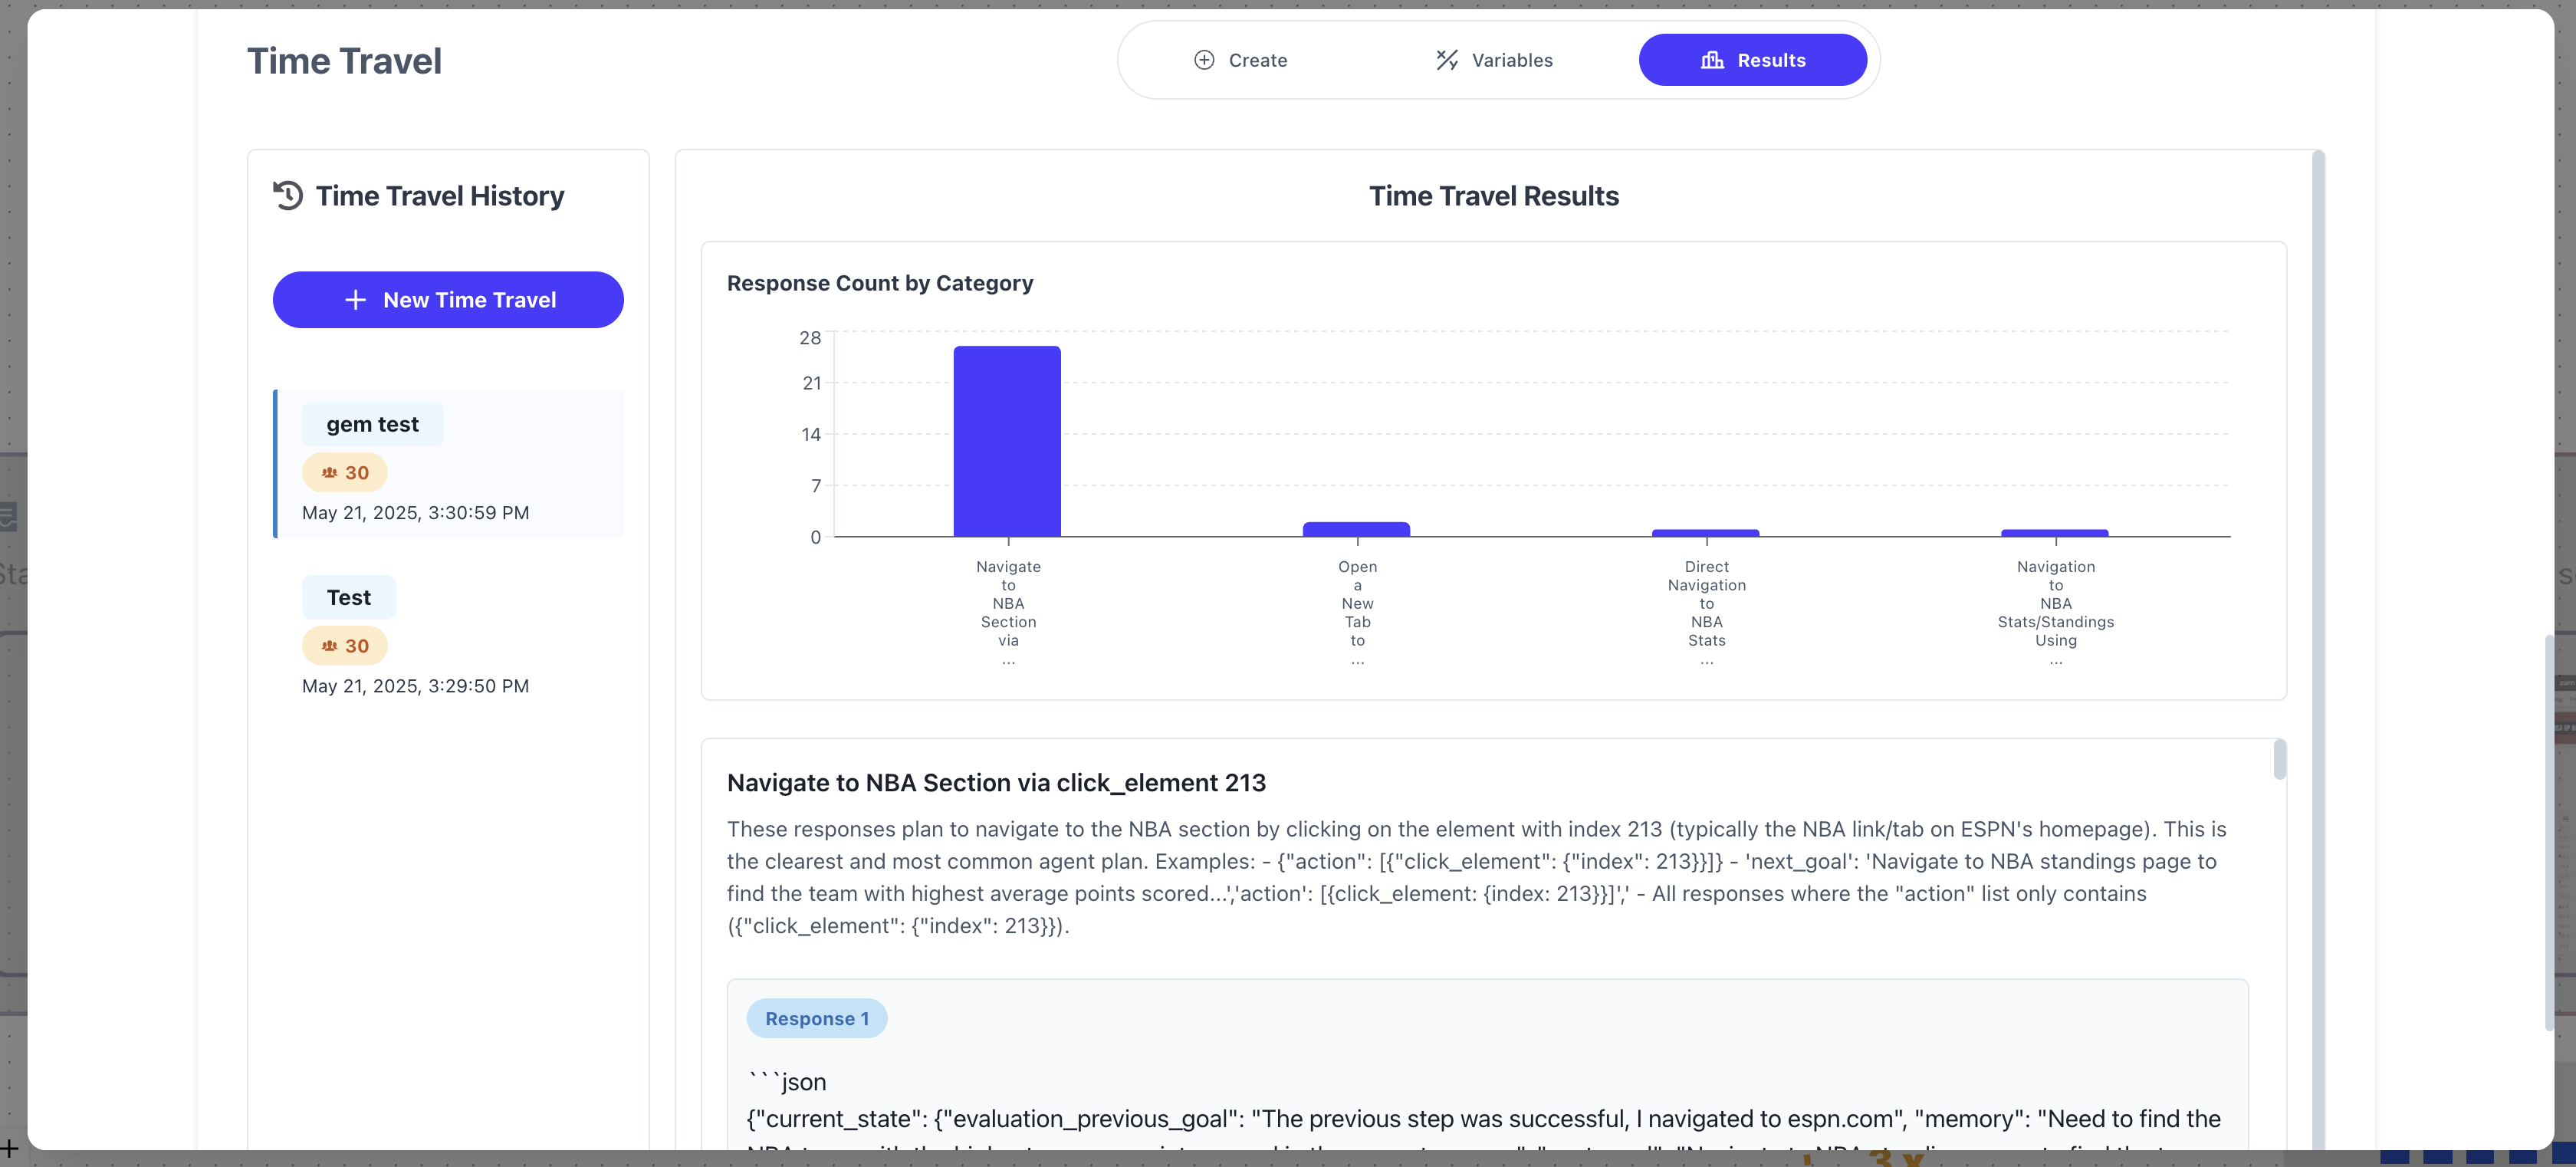
- Scroll down to use the Time Travel feature to see how likely it is that your agent will make a specific action with different parameters (prompt, model, temperature, etc.).
- Click into an edge to view sessions that made that specific transition
- Zoom in to see local behavior or zoom out to see the overall flow
How It’s Built
- Each Session has its own step-wise graph of states and transitions
- As Sessions run, they’re incrementally merged into the Mass Simulation’s Workflow Trajectory
- Steps from different sessions are clustered if they match by state
- Transitions between these clustered states are recorded with frequency counts
Why It Matters
This graph helps you answer critical questions:- What are the most common trajectories the agent follows?
- Where does the agent branch or act inconsistently?
- Are there failure-prone paths that show up repeatedly?
- Do sessions loop, revisit states, or get stuck?
If a task is supposed to be deterministic, any branching in this graph reveals instability in your agent’s behavior.
Probabilistic Insights
You can think of this graph as a probabilistic model of your agent’s behavior:- It reveals which transitions are dominant and which are rare
- It helps you estimate failure rates in certain trajectories
- It surfaces unexpected branches and edge cases